
Figure 4.
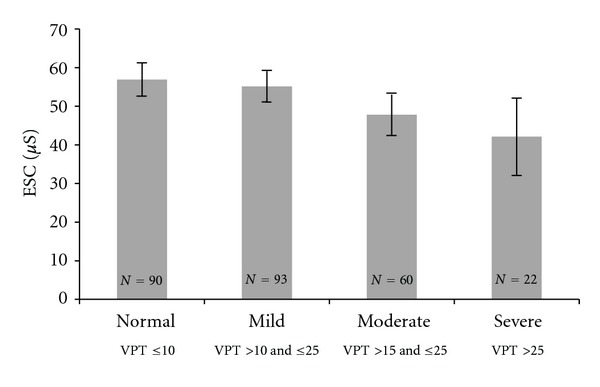
Figure shows association between vibration perception threshold (VPT) (biothesiometry) and electrochemical skin conductance (ESC) in foot (SUDOSCAN). Increasing VPT was associated with decreasing ESC (P < 0.01). Each bar represents mean ± (SE *1.96).