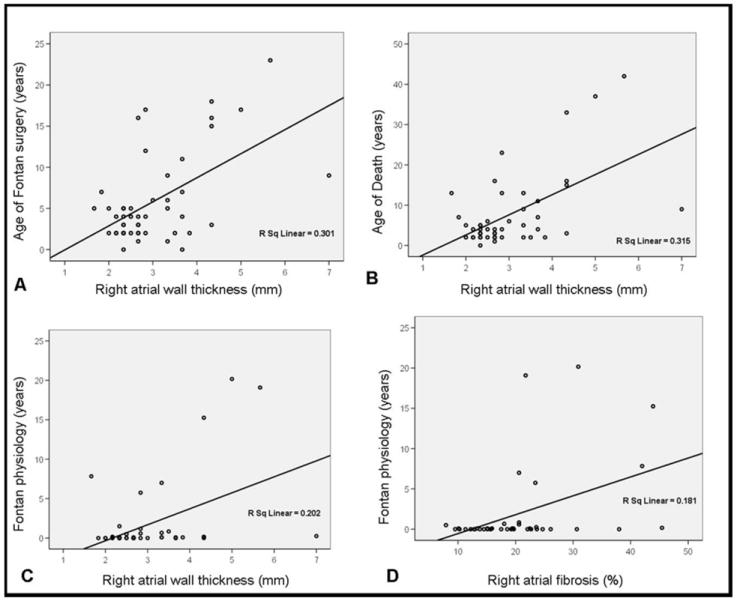
Figure 3. Independent predictors for RA wall thickening and the amount of RA fibrosis.

Scatter plots of RA wall thickness and age of Fontan surgery (A), age at the time of death (B) and Fontan duration (C), and of the amount of RA fibrosis and Fontan duration (D). R Sq Linear = R square (square of the correlation coefficient).
