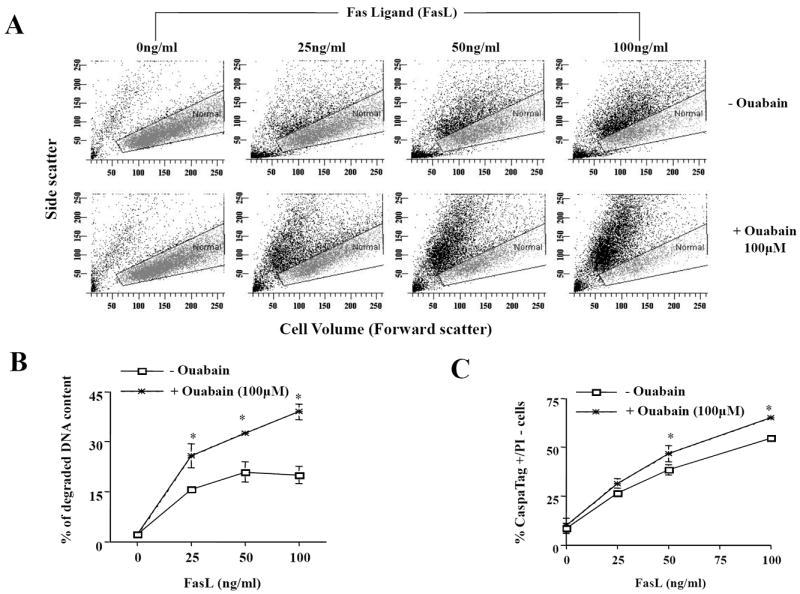
Fig. 1. Effect of ouabain on FasL-induced apoptosis.

Apoptosis was induced by addition of FasL for 4h in the presence or absence of ouabain at a final concentration of 100μM. Cells were analyzed for changes in cell size on a forward- versus side-scatter plot (A), DNA content (B), and caspase 3/7-like activity (C) as explained in materials and methods. In (A), a gate was drawn to depict cells with normal cell size (grey dots). An increase in the number of apoptotic cells (shrunken cells) is reflected as an increasing number of cells falling outside the gated area assigned for normal cells. Cell shrinkage or AVD is observed as a decrease in the amount of forward-scattered light which is proportional to cell size in coordination with a change in side-scattered light that is proportional to cell density or granularity. In B, data represents the % of cells with subdiploid DNA content In C, data represent the % of cells with increased FLICA (increased activation of execution caspases) and low PI fluorescence (integral plasma membrane integrity). Shown are either averaged values ± SEM from three independent experiments (B and C), or a single representative experiment from five independent experiments (A). Asterisks (*) indicate statistical significance (P<0.05) between the two experimental conditions at each concentration of FasL.
