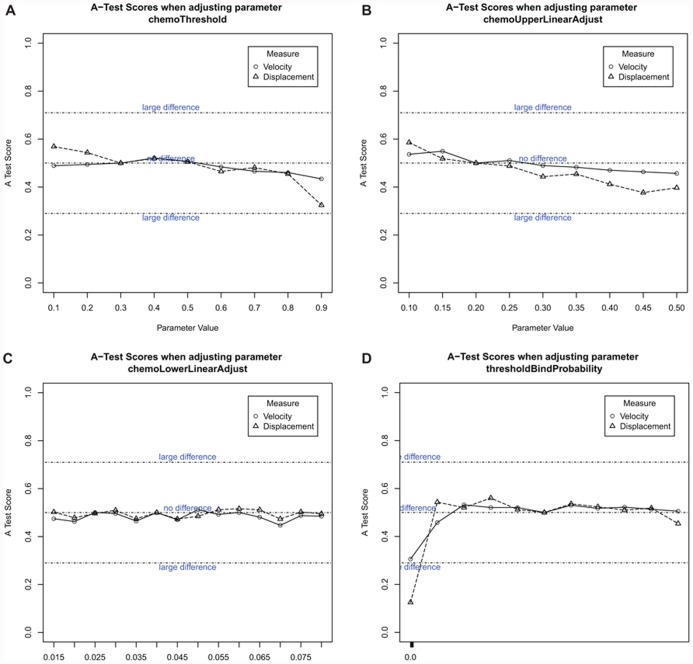
FIGURE 10.
Robustness analysis of simulation use a one-parameter-at-a-time approach, which perturbs the value of just one parameter, leaving the remaining values constant in the simulation. This provides an indication of the effect perturbing each individual parameter has on simulation output. Cell behavior was compared to the calibrated baseline results using the Vargha–Delaney A-Test, which determines if two distributions statistically differ. Plots of A test score vs parameter values was plotted with the change from observed cellular behavior varies significantly from the simulation. (A) Chemokine threshold, (B) initial expression level of chemokine, (C) maximum expression level of chemokine, (D) probability of stable bind when two cells are in contact. N = 500.

