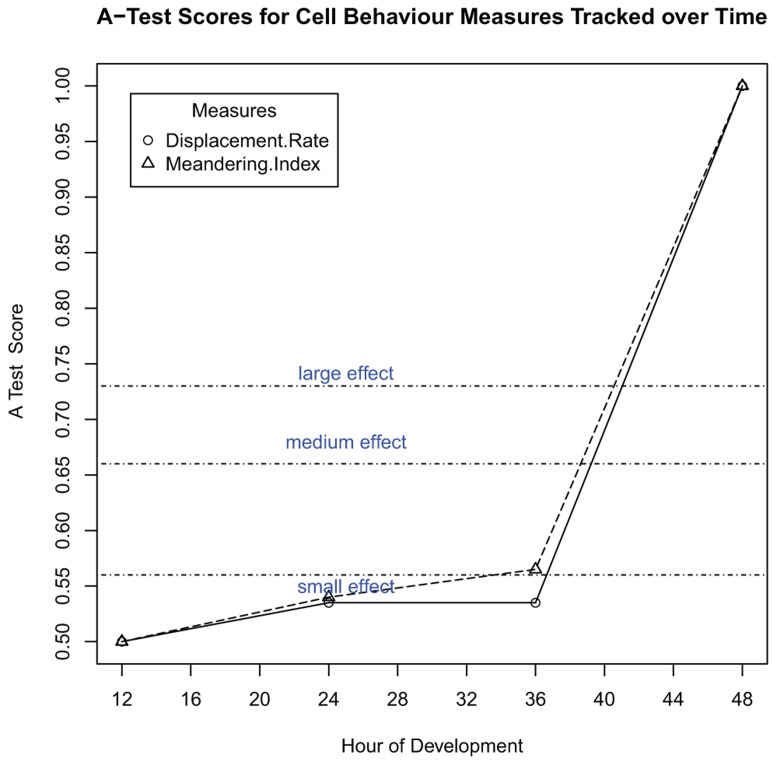
FIGURE 12.
Computer simulation to predict when chemokine expression level has a significant effect on cell behavior. For 24, 36, and 48 h time-points, datasets have been generated which record the displacement of each cell in the system for a sixty minute period after that time-point. Each set of results is then compared to the simulation baseline cell behavior at 12 h using the Vargha–Delaney A-Test.

