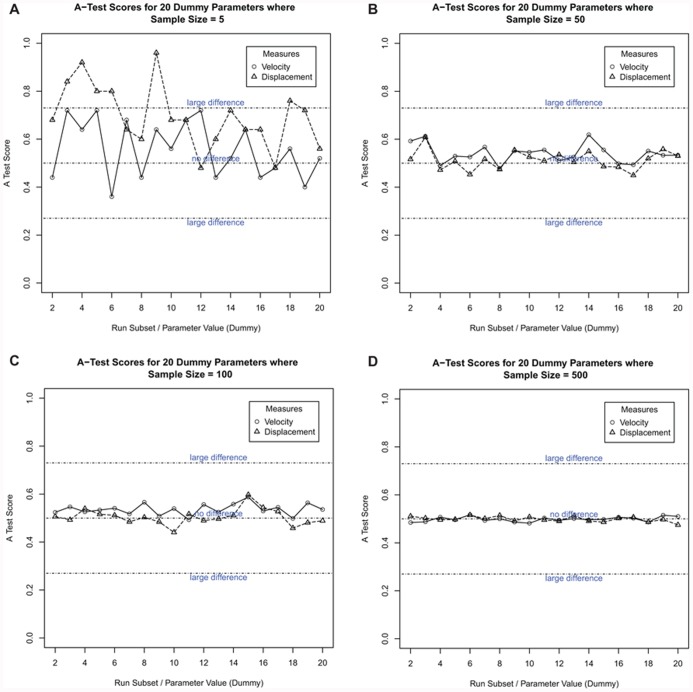
FIGURE 8.
Robustness analysis to determine the number of replicate simulation runs necessary to produce a robust, representative result. The twenty result subsets are listed along the x axis, with the Vargha–Delaney A-Test score on the y axis. The subsets are labeled as “dummy parameter” sets as no parameters are being changed. The plot shows the comparison scores for both cell behavior output measures: cell velocity and cell displacement. Each of the 20 result subsets contains a number of simulation run results. From these, a set of results is generated containing the median of each cell output measure for each simulation run in the set. Each set of medians is then compared to the first set using the Vargha–Delaney A-Test. This figure shows the results for four of the sample sizes used. (A) 5, (B) 50, (C) 100, and (D) 500.

