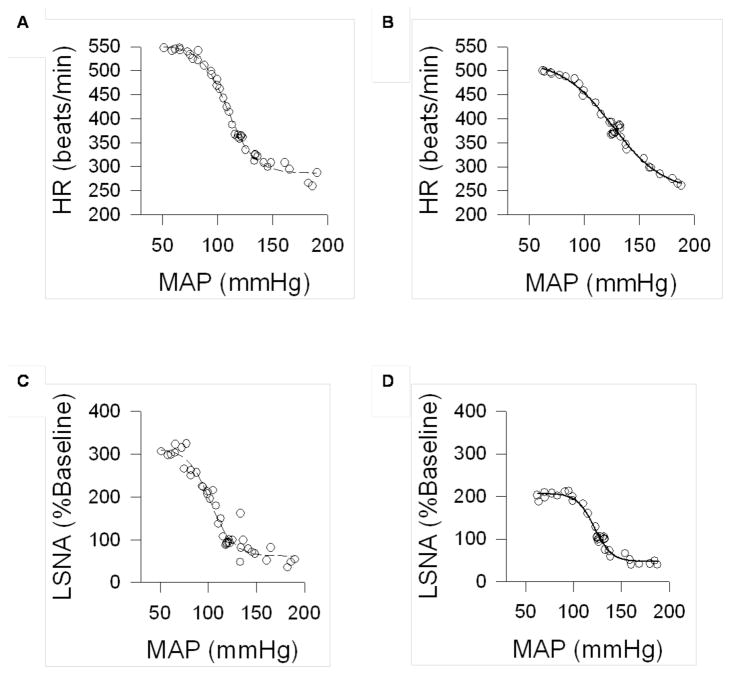
Figure 3.
Sigmoid curves showing baroreflex control of heart rate (HR; Panels A and B) and lumbar sympathetic nerve activity (LSNA, calculated as a percentage of baseline nerve activity; Panels C and D), illustrating goodness of fit for a control (Panels A and C) and chronic mild stress (CMS; Panels B and D) rat. Circles represent recorded data points, and the line represents the fit curve.

