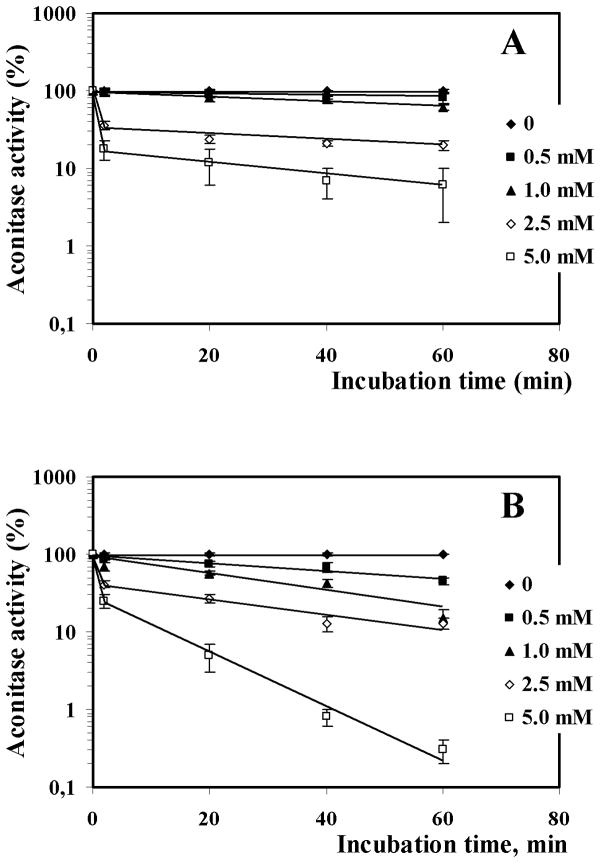
Fig. 4.
In vitro inactivation of aconitase by menadione (0.5–5 mM) in 50 mM phosphate (A) and bicarbonate (B) buffers. Activity was determined at 0, 2.5, 20, 40, and 60 min incubation. The data shown are the mean ± SEM (n = 3). The Y-axis is logarithmic, allowing visualization of the first-order process. The 2.5 min point gives the initial inactivation rate.

