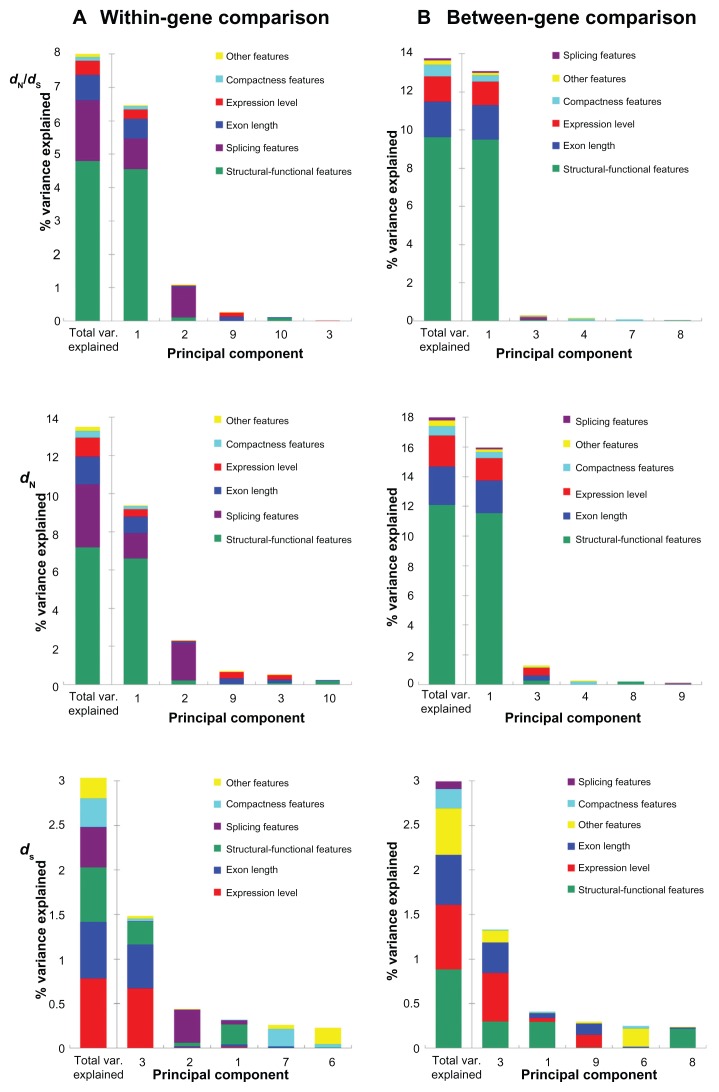
Figure 1.
The percent of variances in dN/dS (upper panel), dN (middle panel), and dS (lower panel) explained by the principal components for (A) the within-gene comparison; and (B) the between-gene comparison.
Notes: Only the five most important components are shown here. The leftmost bar in each panel indicates the total variances explained by all of the eleven components.

