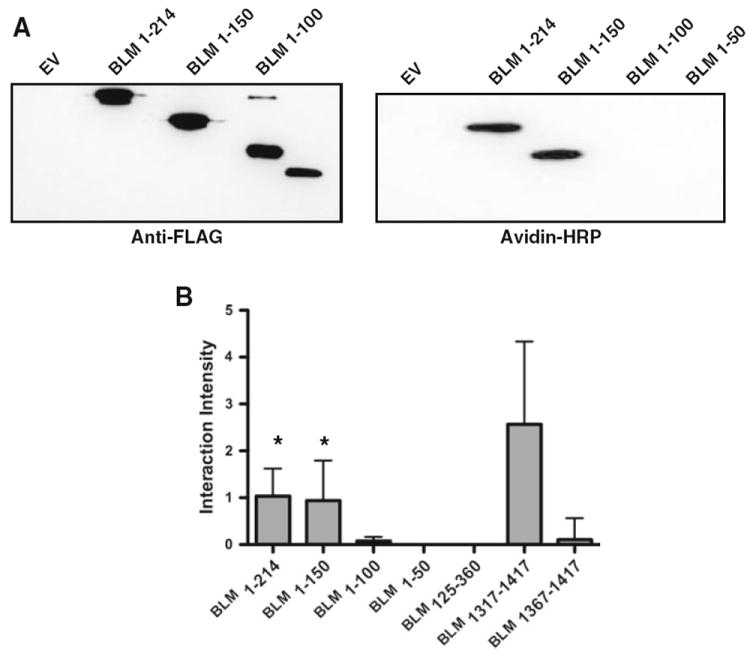
Fig. 3.

Southwestern analysis. a Representative data from one of three independent trials. The left panel shows the BLM fragments probed with anti-FLAG (M2) antibody. The right panel shows the same fragments incubated with biotin labeled ssDNA and probed with HRP-conjugated avidin. b Quantification of southwestern analysis of BLM fragments shown in (a). Graph represents the mean of three independent trials with standard deviations indicated. One-way ANOVA analysis was completed for all fragments with Dunnett’s multiple comparison test with BLM1317–1417 as control. Statistical significance of p < 0.05 is indicated with an asterisk
