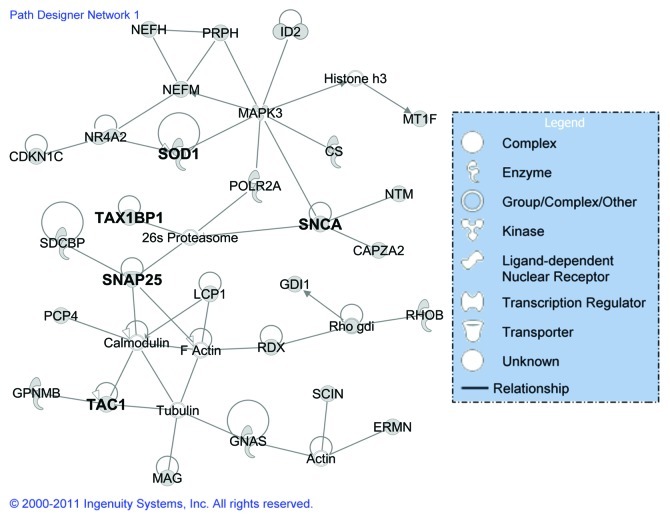
Figure 2. The highest scoring gene network based on classification of DE genes from elk brain tissues (brain, midbrain and thalamus) using the Ingenuity Pathway Analysis. The shape of the node indicates the major function of the protein and a line denotes binding of the products of the two genes. The genes in bold have been validated by qRT-PCR.

An official website of the United States government
Here's how you know
Official websites use .gov
A
.gov website belongs to an official
government organization in the United States.
Secure .gov websites use HTTPS
A lock (
) or https:// means you've safely
connected to the .gov website. Share sensitive
information only on official, secure websites.
