Figure 3.

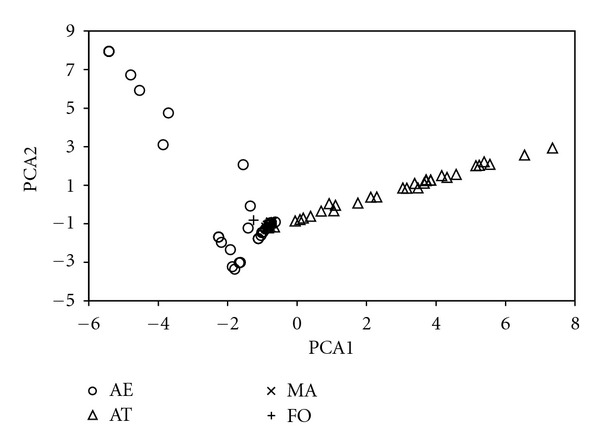
Principal component plot showing the similarities between use reports in the four studied territories. See Figure 1 caption for abbreviations.

Principal component plot showing the similarities between use reports in the four studied territories. See Figure 1 caption for abbreviations.