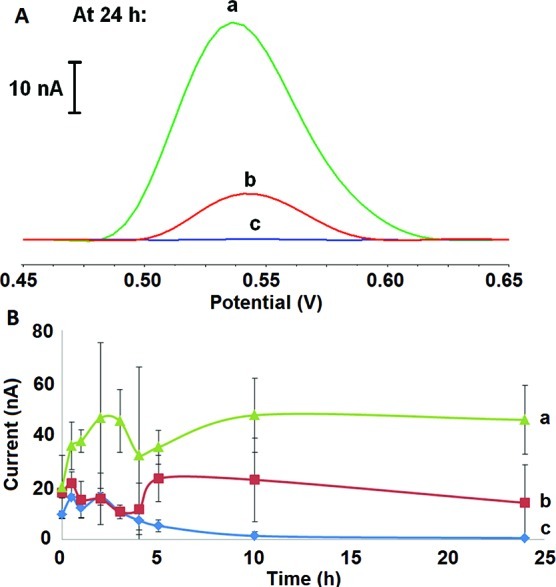
Figure 4.

(A) Square-wave voltammograms of Tyr oxidation in α-S that was incubated with varying concentrations of DA for 24 h. (B) Plot for the dependence of Tyr oxidation current signals on time with (a) α-S in the presence of 0.5 mM DA, (b) α-S only, and (c) α-S in the presence of 5 mM DA in PBS buffer at pH 7.4 and 37 ± 1 °C with shaking for 24 h.
