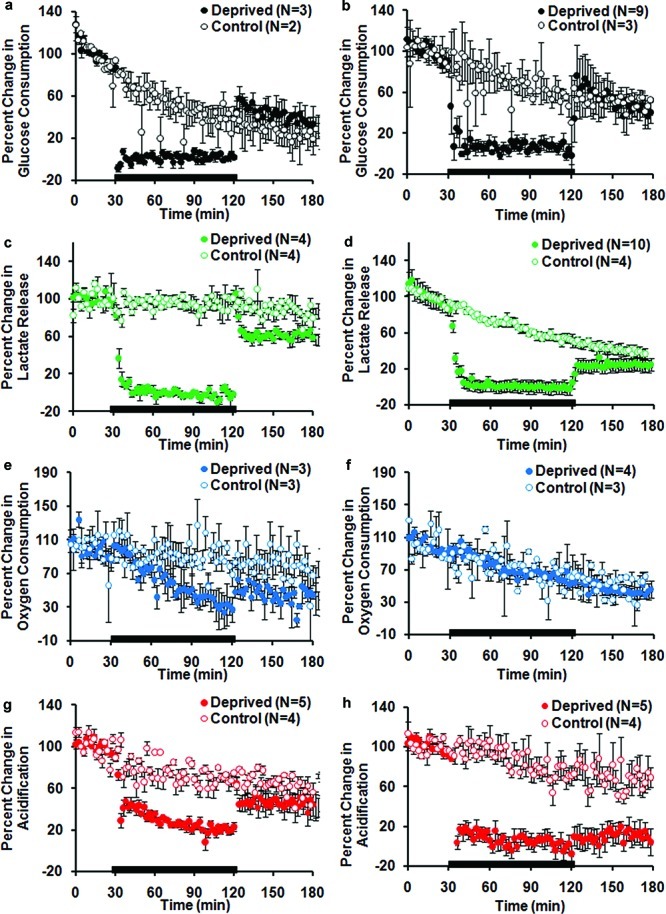
Figure 2.

Percent change in pure neuronal and mixed culture metabolites during 90 min GD. Each data point is the average rate of consumption or production at each stop-flow period (every 2 min). Average of replicate for deprived and control chambers ± SEM. The black bar represents the GD time course. (a) Glucose consumption, neurons. (b) Glucose consumption, mixed. (c) Lactate production, neurons. (d) Lactate production, mixed. (e) Oxygen consumption, neurons. (f) Oxygen consumption, mixed. (g) Acidification, neurons. (g) Acidification, mixed.
