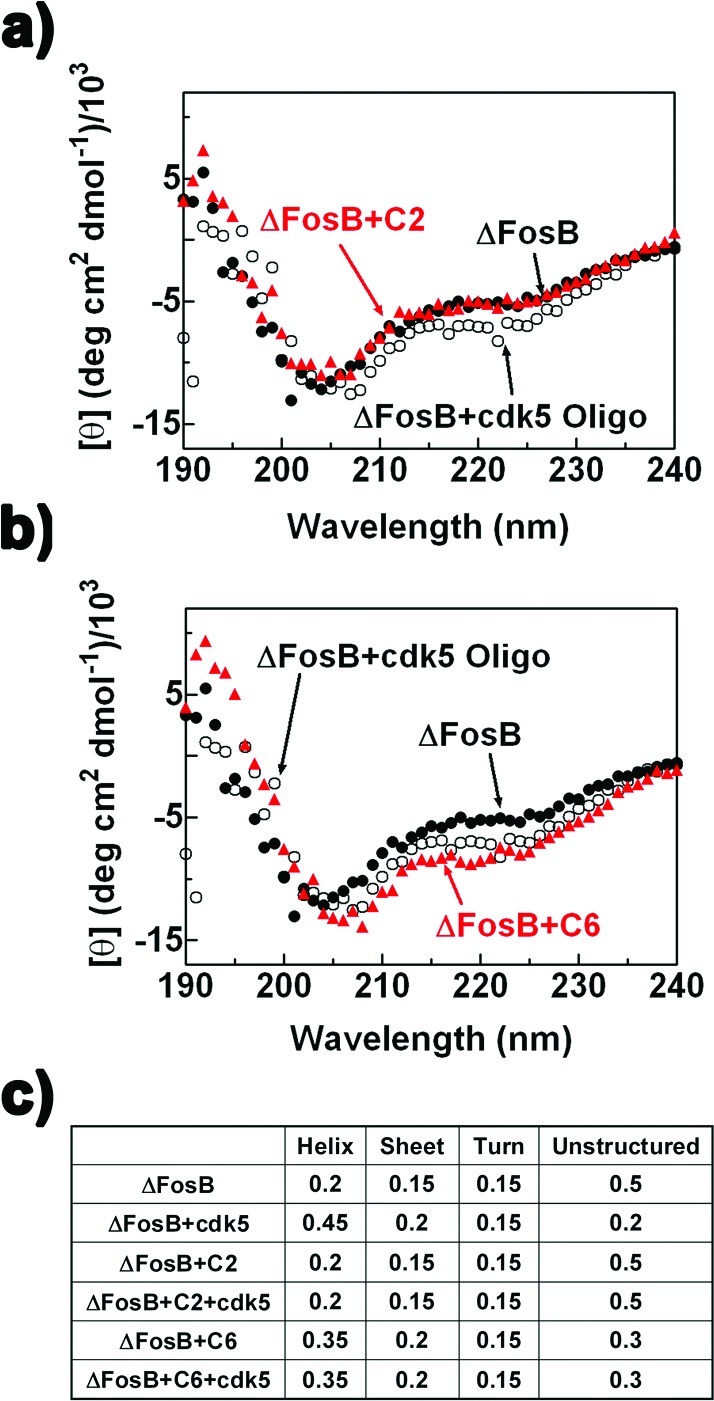
Figure 6.

Changes in the secondary structure of ΔFosB monitored by CD. (a) CD spectra of ΔFosB alone, with cdk5, and with 100 μM C2. (b) CD spectra of ΔFosB alone, with cdk5, and with 100 μM C6. (c) Deconvolution of the CD spectra and secondary structural content (in %) of ΔFosB, ΔFosB with cdk5, ΔFosB and C2 with or without cdk5, and ΔFosB and C6 with or without cdk5.
