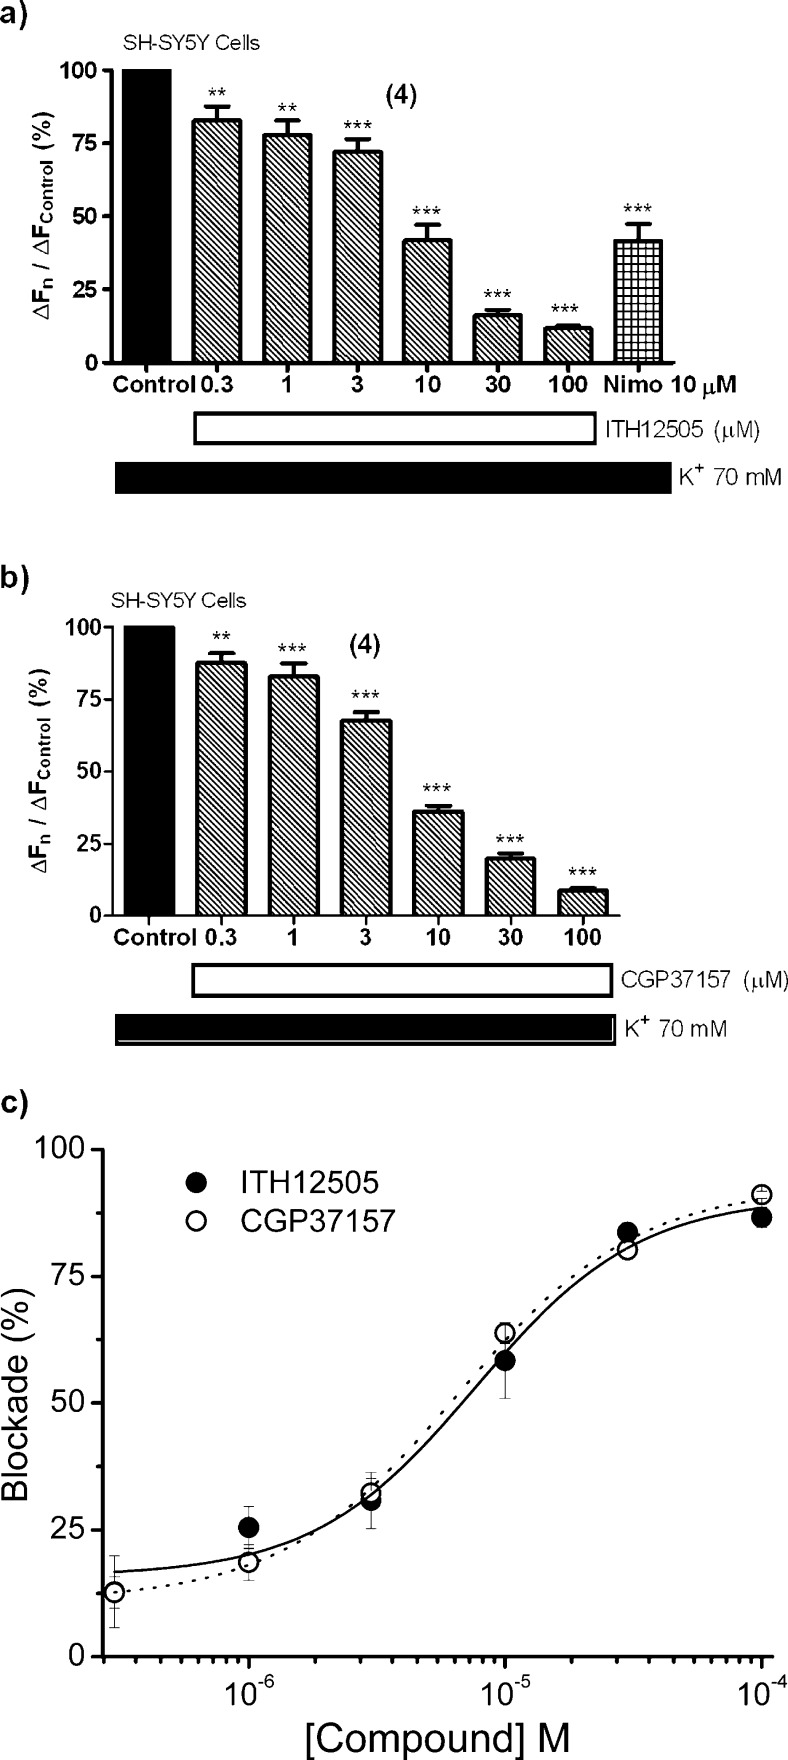
Figure 8.
Blockade by ITH12505 (a) and CGP37157 (b) on the [Ca2+]c increase induced by high K+ in SH-SY5Y neuroblastoma cells. Panel (c) shows nonlinear regressions of increments of blockade versus concentration for ITH12505 (black circles, continuous line) and CGP37157 (white circles, dotted line). Data are mean ± SEM of at least four independent experiments: **p < 0.01, ***p < 0.001 respect to control.

