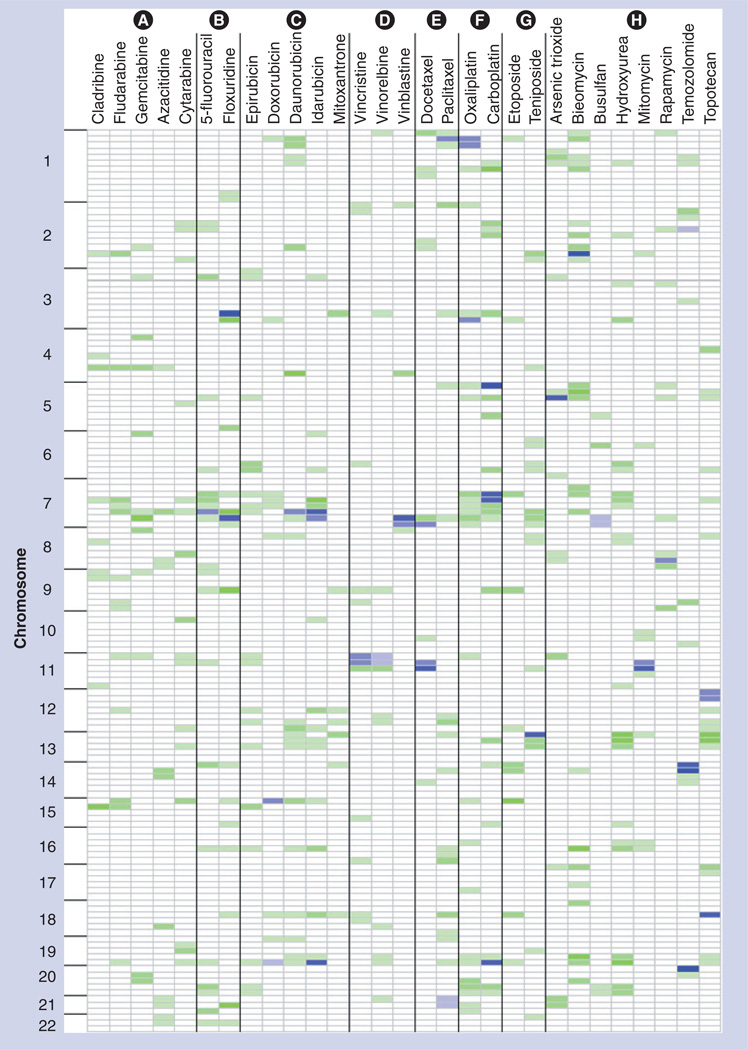
Figure 2. Genome-wide patterns of quantitative trait loci for all drugs, arranged by mechanistic classes.
Each chromosome was partitioned into 25-cm regions. For each drug at the dose that resulted in the highest heritability estimate, any putative significant pharmacologic quantitative trait loci regions (log10 of odds > empirical significance cut-off) is indicated in blue. Intensity of the shading is dependent on the total number of additional doses that indicated a replicating signal at either a suggestive or significant level, with higher intensity indicating higher numbers of doses. Regions that also had at least a suggestive pharmacologic quantitative trait loci, as well as at least one additional replication in another dose, are shown in green, where again intensity of the color represent a higher number of dose replications. Drugs are grouped according to their mechanism of actions, where the groups are labeled as follows: Group (A): ribonucleotide reductase inhibitors; Group (B): thymidylate synthase inhibitors; Group (C): DNA intercalators and topoisomerase 2 inhibitors; Group (D): microtubule destabilizers; Group (E): microtubule stabilizers; Group (F): DNA crosslinkers; Group (G): topoisomerase 2 inhibitors; Group (H): other.

