
Figure 3.
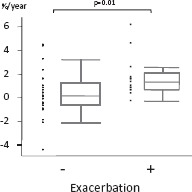
Annual emphysematous change represented as LAA% on CT in patients without / with a history of exacerbations. (LAA (%): 0.12 versus 1.32, p = 0.01) The horizontal line is the median value, the box is the interquartile range, and the whiskers indicate the range, excluding outlying and extreme values (i.e., points with values ≥1.5 box lengths from the upper or lower limits of the box). LAA, low attenuation area; CT, computed tomography.