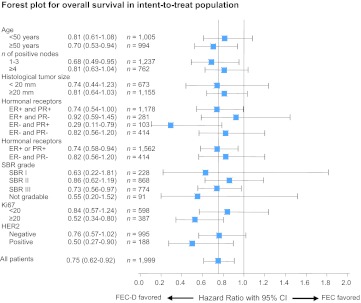
Figure 2.
Analysis of treatment effect by subgroups in the intent-to-treat population. Hazard ratios and 95% confidence intervals are reported in different subgroups (Forest plot analysis) for overall survival rates.
Abbreviations: CI, confidence interval; D, docetaxel; ER, estrogen receptor; FEC, fluorouracil, epirubicin, and cyclophosphamide; HER2, human epidermal growth factor receptor 2; PR, progesterone receptor.

