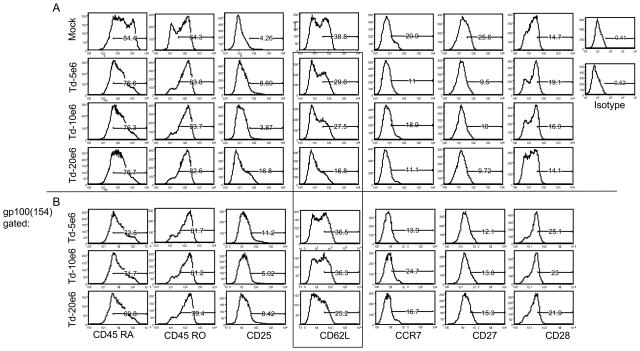
Figure 4.
T cell phenotype. The transduced cells described in Figure 3 were analyzed using a panel of differentiated markers, gp100 (154) tetramer positive cells (below line) were gated out of total population (above line), and the differentiated markers were plotted as above. The CD62L+ cells from the total population versus gp100 (154) tetramer positive population was highlighted by the box.

