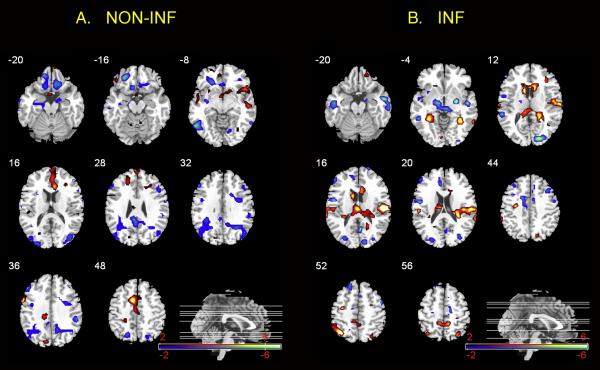
Figure 3. NON-INF and INF projection plots.
Average correlations from reliable network regions across conditions and days A. Regions project in red are positively correlated with stimulus ratings where as regions in blue are negatively. B. Regions project in blue are positively correlated where as regions in red are negatively correlated with the stimulus ratings. INF=inflation NONINF=non-inflation

