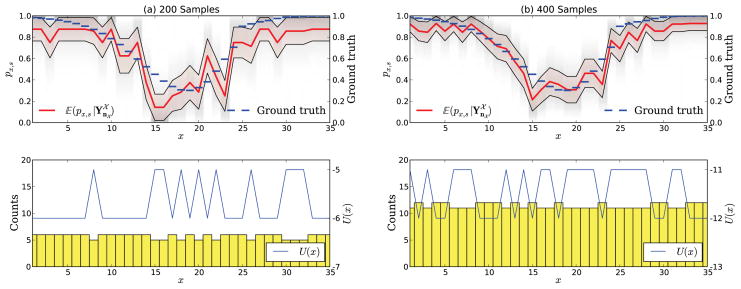
Figure 3.
A hypothetical experiment with (a) 200 and (b) 400 samples uniformly distributed over the stimulus space
 . The stimulus-response relation (ground truth), shown as dashed line, is inferred without taking information from proximal x into account. The thick continuous line shows the first moment
of the stimulus-response function given all outcomes of previous measurements. The standard deviation is shown as a thin continuous line around the expectation. The marginal posterior density
is plotted as shadings in the back of the figure. The number of measurements at each x ∈
 is shown as a bar plot in the lower plot with utility U (x) (thin continuous line), which is the negative number of counts, see (17).

