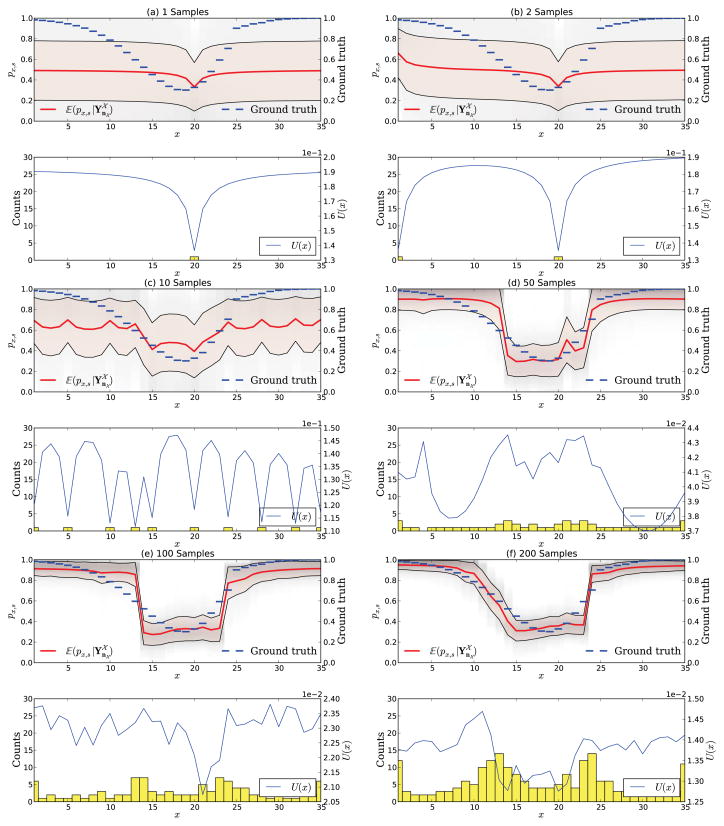
Figure 5.
Adaptive sampling in a hypothetical experiment with scheme uΨ. The figure shows the experiment after 1, 2, 10, 50, 100, and 200 samples. At first, samples are uniformly distributed. In (a) only one measurement was taken and the expected utility is largest at the left boundary. (d) shows the experiment after 50 samples where the algorithm starts to locate measurements at sloped regions. The general shape of the stimulus-response function is already well established after 100 samples (e). Many measurements are also taken at x = 1 and x = 35 since those x have only one neighbor.

