Figure 1.
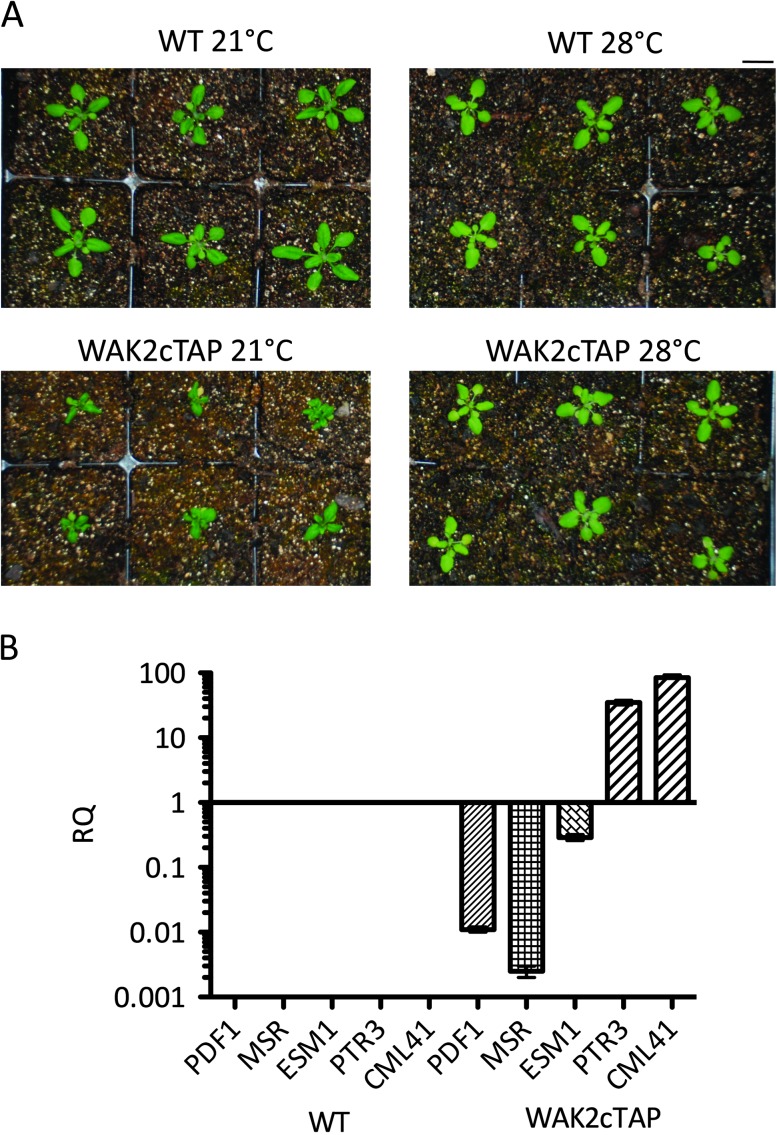
WAK2cTAP phenotype is affected by temperature.(A) Wild-type (WT) and WAK2cTAP-expressing plants grown at 21 or 28°C. Six plants are shown for each condition. Bar top right indicates 14 mm.
(B) QPCR of five of the 2600 genes that showed changes in expression levels higher than twofold in a WAK2cTAP background compared to wild-type (WT). The y-axis in log scale shows expression relative (RQ) to wild-type that was set to a value of 1, n = 3. The x-axis indicates the genotype (WT or WAK2cTAP) and the gene (PTR3, PDF1, MSR, CML41, or ESM1).

