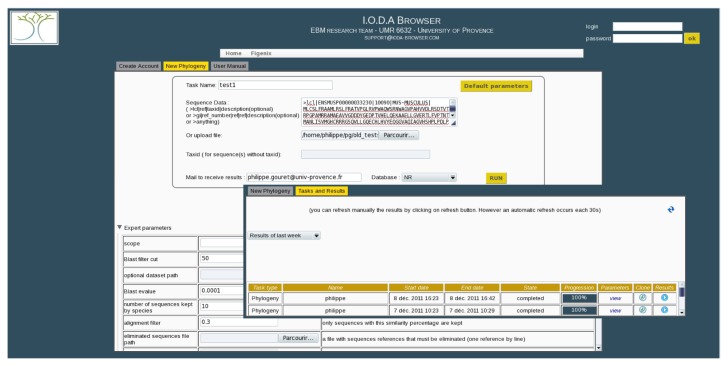
Figure 1.
At the top of the task creation window (upper left on the figure), one can see the most commonly used parameters, specially the protein sequence to be used as a query and the database to search homolog sequences.
Notes: At the bottom of the task creation window, expert parameters are displayed when the area is unfolded. Each parameter has a default value and a description. The tasks management window (lower right on the figure) is a table with the list of tasks started by the user during a chosen period of time. (Set to “week” on the figure). By reading one line of the table, one can see that the user can follow the progression and the state of a task, its parameters, its results (even if the task is not over). User can also clone tasks.

