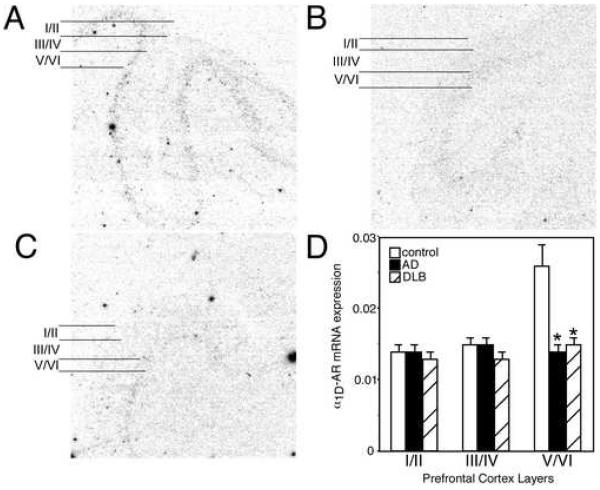
Figure 5. α1D-AR mRNA expression is reduced in the PFC of AD and DLB subjects.
α1D-AR mRNA expression in the PFC of (A) control (n=17), (B) AD (n=15), and (C) DLB (n=21). The greatest amount of α2A-AR mRNA expression in control subjects is observed in layer V/VI with lowest level of expression in layer I/II and III/IV. Layers for data analysis are shown to the left of the autoradiograms for control, AD and DLB subjects. (D) Quantification of α1D-AR mRNA expression in the different layers of the PFC in control, AD and DLB subjects. * Significant difference (p<0.05) compared with control subjects. Data are represented as mean ± SEM.

