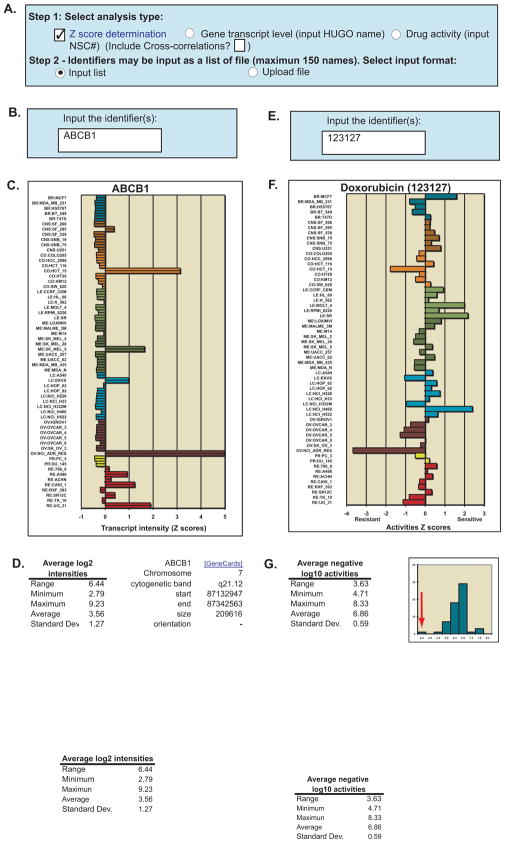
Figure 2.
Relative transcript expression and drug activity levels in the NCI-60. A. Check the “Z score determination” check-box, and then choose either the “Gene transcript level” or the “Drug activity” radio button in step 1. In those instances in which multiple genes or drugs are entered, a cross correlation of all genes or drugs entered may be included by checking the “Include cross-correlations” check box. In Step 2, the user chooses whether to type in the input, or upload it as a file by selecting “Input list” or “Upload file” (as .txt or .xls), respectively. B. For relative transcript expression levels, input the gene name(s) using the “official” (HUGO) name. C. A graphical z score composite of all transcript probes that pass quality control is generated, along with the numerical values (data not shown). D. Mean log2 intensity values for range, minimum, maximum, average, and standard deviation for all Affymetrix probes are included to assist in data interpretation, as well as chromosomal location. E. For relative drug activity levels, input the drug “official” NSC number(s) (see “Download NSCs” file from Figure 1B, Step 1, for a listing of these). F. A graphical z score composite of all drug experiments that pass quality control is generated, along with the numerical values (data not shown). G. Mean log10 intensity values for range, minimum, maximum, average, and standard deviation for all experiments are included to assist in data interpretation, as well as a histogram of the cell lines average activities. For the histogram, the x-axis is the average experiment activity for the cell lines, and the y-axis the frequency at which they occur. The red arrow indicates the most resistant cell line to doxorubicin, NCI-ADR-RES.

