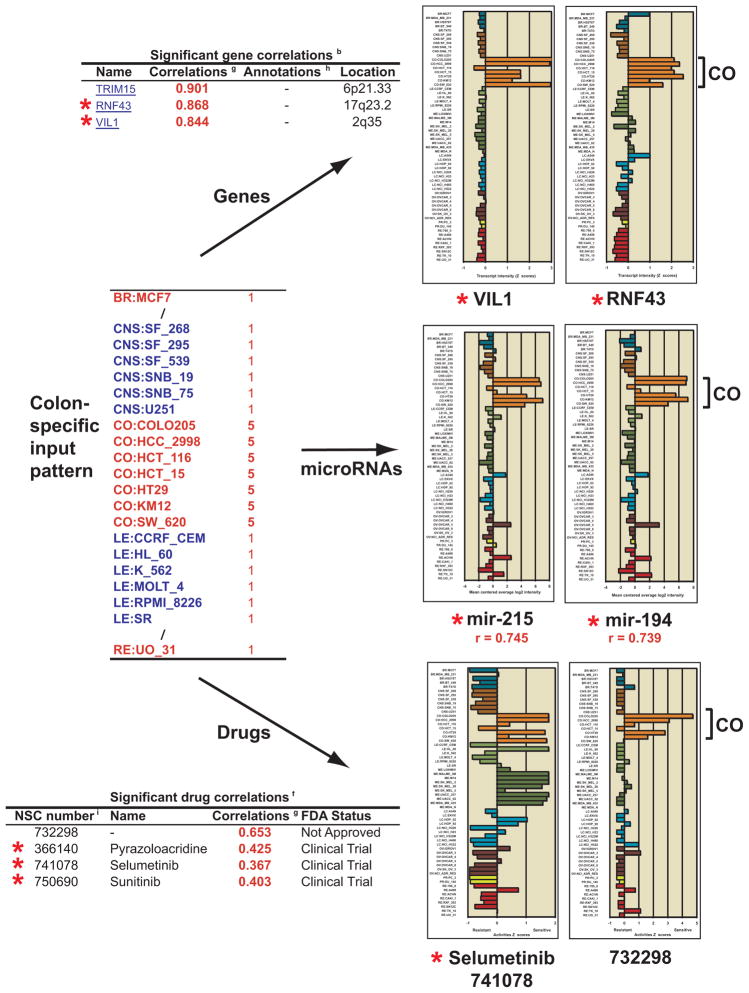
Figure 5.
Pattern comparison example for a colon-specific input pattern. The input for this analysis consisted of ones for all non-colon cell lines, and fives for all colon. The three forms of output described in Figure 4, genes, microRNAs, and drugs, are shown. The top three genes by correlation are shown in tabular fashion. Bar graphs for two of the genes, generated as described in Figure 2, display the data visually. The top two microRNAs by correlation are shown next in graphical fashion, generated as described in Figure 3. The top three drugs with either the FDA-approved or clinical trials by correlation, and one clinically untested compound are shown in tabular fashion. Bar graphs for two of these, generated as described in Figure 2, are displayed. The red star in all cases indicates prior literature association with colon cancer.

