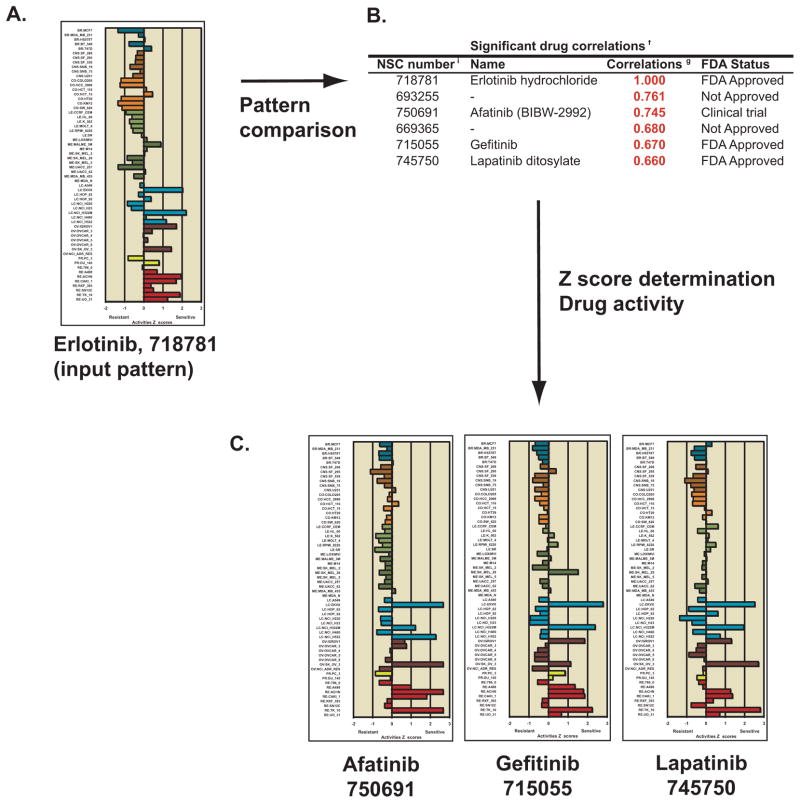
Figure 6.
Recognition of drugs with similar mechanism of action, using erlotinib as an input for pattern comparison. A. Use the “Pattern comparison” tool (Figure 4) selected for “Drug NSC” and input 718781 (the NSC for erlotinib). The bar graph shown is that from the “Z score determination” tool from Figure 2, selected for “Gene transcript level”. B. The top six rows of the “Significant drug correlations” output from the “Pattern comparison” tool, identifying two other FDA-approved drugs and one in advanced clinical trials. C. The bar graphs shown are from the “Z score determination” tool from Figure 2, selected for “Gene transcript level” for the two FDA-approved, and one in clinical trials drugs identified in B.

