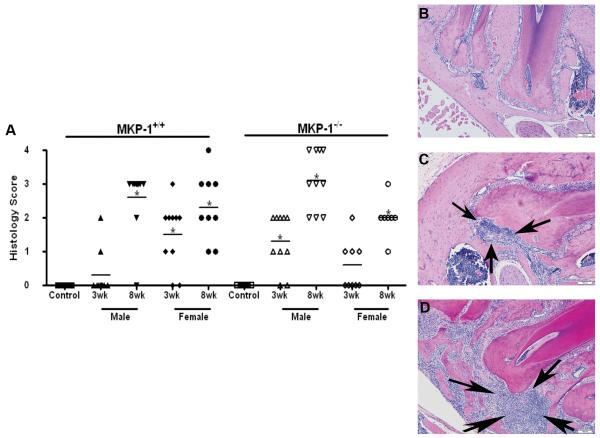
Figure 2. Histopathology indicates that male mkp-1−/− male mice have increased neutrophil infiltrate.
(A) Scatter plot analysis with mean histopathologic scoring of neutrophil infiltrate indicated by horizontal line from control and 3-and 8-week treated groups in wild type and mkp-1−/− mice. Representative H&E slides corresponding to periapical areas used for histopathologic analysis of control group (B), 3-week treatment group (C) and 8-week treatment group (D), All histological images are from mkp-1−/− male mice. Arrowheads indicate neutrophil infiltrate and scale bar is 100μM. (N= 10/group; *P<.05).

