
Figure 3.
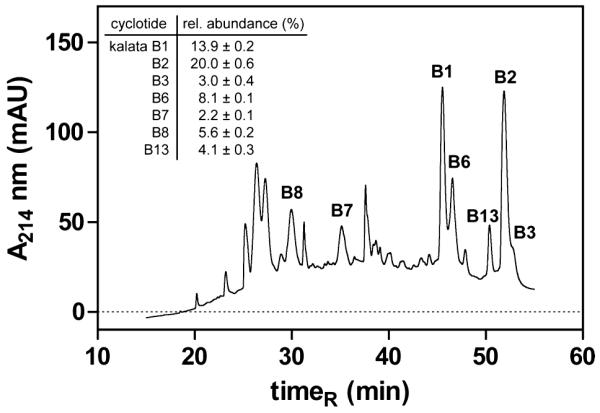
Nano LC-MS chromatogram of O. affinis cyclotides. The nanoflow elution profile of cyclotides from O. affinis was monitored with UV absorbance at 214 nm and mass spectrometry. The HPLC graph of a representative crude cyclotide extract is shown, and its major cyclotides are indicated by name and relative abundance. The relative cyclotide content (mean ± SEM) was determined by peak integration of five independent experiments (file S3). HPLC and MS conditions for cyclotide analysis are shown in the Experimental Section.