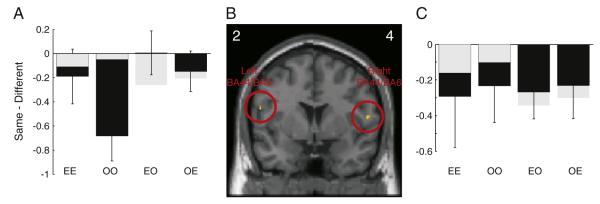
Fig. 2.
Main effect of repetition suppression for action type, whereby there was lower activation when the same action was executed or observed for a second time, compared with a different action, irrespective of whether the first action was observed or executed. (B) shows SPMs of the t-values from the group level. The SPM is shown for the coronal slice at maximal activity in the left and right hemispheres separately. The y co-ordinates for the peak voxel are shown in the left and right corners. The SPM image is thresholded for display at p<0.005 uncorrected. The open red circles indicate the significant clusters. (A,C) black bars show the mean difference in beta values between the repetition of the same or different action type at the peak voxel shown in B (E = executed/O = observed action). Negative values are consistent with repetition suppression. Error bars are standard error of the mean. The grey bars in A and C show the effects at the peak voxel for just the cross-modal conditions that was within a small volume of 1 cm radius from the peak previously reported for this contrast (Kilner et al., 2009).

