
Fig. 5.
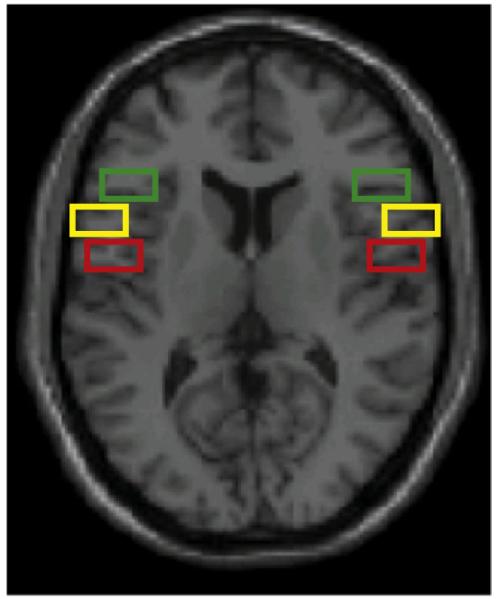
Post-hoc region of interest analysis. The 6 ROIs are displayed on a single slice of the canonical single subject structural image. Red boxes show the extent of the left and right BA44/BA6 ROI, yellow boxes show the extent of the left and right anterior BA44 ROI and the green boxes show the extent of the left and right BA47 ROI (see Materials and methods for more details).