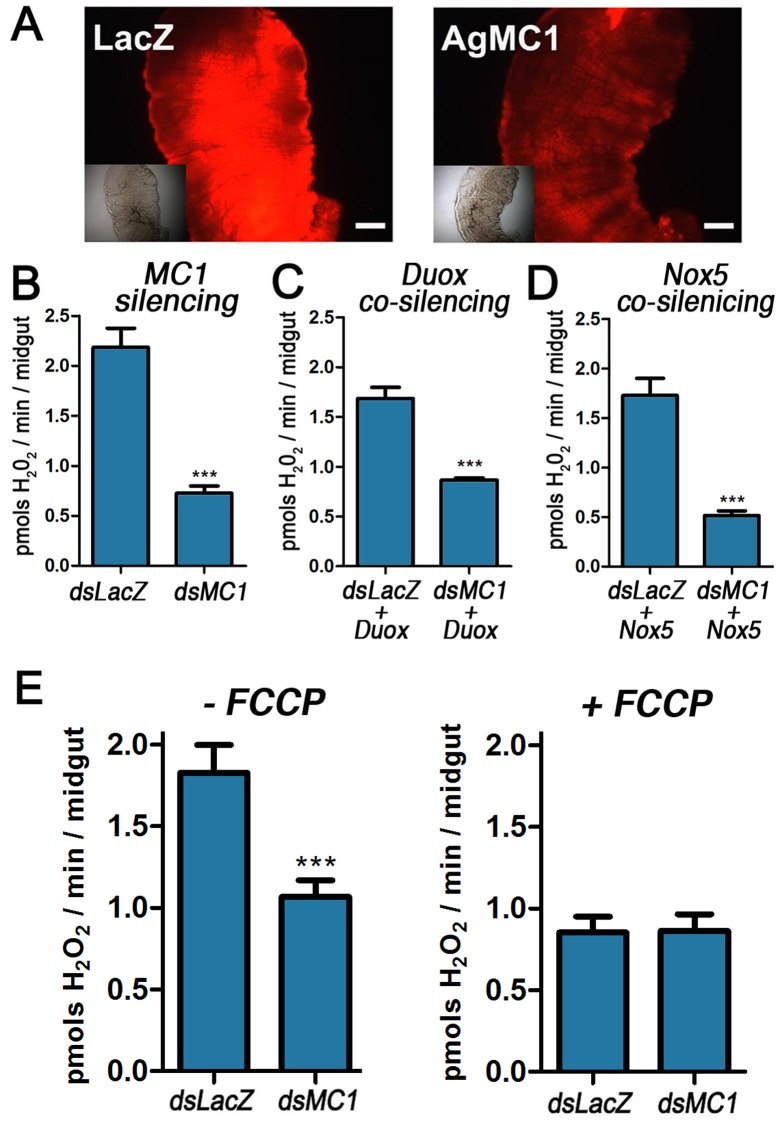
Figure 4. Effect of AgMC1 silencing on mitochondrial ROS generation in the midgut.
(A) Control (dsLacZ) and dsAgMC1-silenced midguts from sugar-fed mosquitoes were incubated with dihydroethidine (DHE), a dye that becomes fluorescent in response to ROS. DIC images of the same midguts are shown in the inset. Scale bar = 100 µm. (B) Effect of AgMC1 silencing, co-silencing Duox (C) or NOX5 (D) or adding FCCP (E) on midgut H2O2 generation detected using the Amplex red assay. Resorufin fluorescence was measured at 590 nm. Bars represent means ± SE. Significant differences are indicated by the asterisks (***indicates P<0.001; Student’s t-test).

