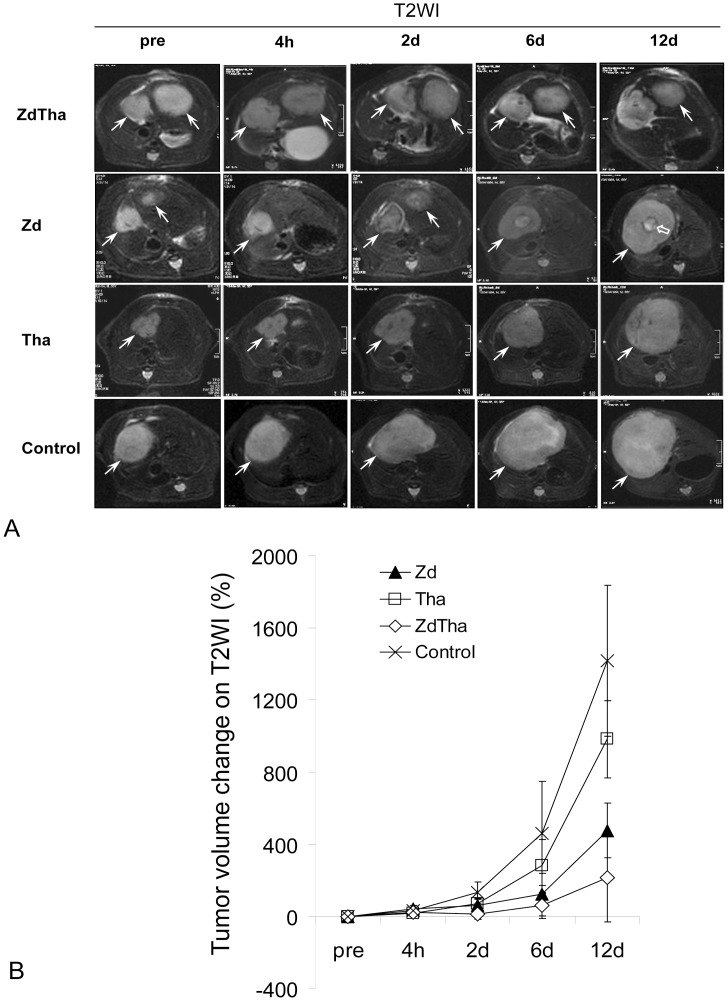
Figure 2. Tumor growth delay after treatments.
Among the four treatment groups, ZdTha induced the longest delay in tumor growth over the examined period. (A) Representative axial images of liver tumors, acquired with T2-weighted images (T2WI) (TR/TE = 3860/106 ms). Top row: The tumors (arrows) in both left and right liver lobes showed very little growth over the examined period of ZdTha treatment. Row 2: The right tumor regrew rapidly from 2 d after Zd treatment; note the reduction in central necrosis (open arrow); Row 3: The tumor grew remarkably during Tha treatment; Bottom row: The tumor grew significantly in the control group. (B) Tumor volume changes after treatment compared to pretreatment measured on T2WI in the four treatment groups (mean ± standard deviation). Between 2 d and 12 d after treatment, the ZdTha group exhibited significantly smaller tumor volume changes compared to the other 3 groups (P<0.05) (Table S1).

