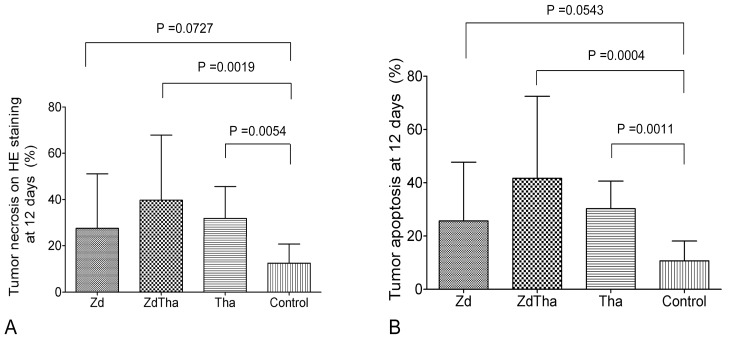
Figure 4. Tumor necrosis and apoptosis at 12 d after treatment.
(A) The percentages of necrotic compared to total tumor areas detected on HE-stained tumor sections were significantly higher in ZdTha and Tha groups compared to the control group (P = 0.0019 and P = 0.0054, respectively). (B) Similarly, the percentages of apoptotic areas compared to total tumor areas detected on immuno-stained tumor sections were significantly higher in ZdTha and Tha groups compared to the control group (P = 0.0004 and P = 0.0011, respectively).

