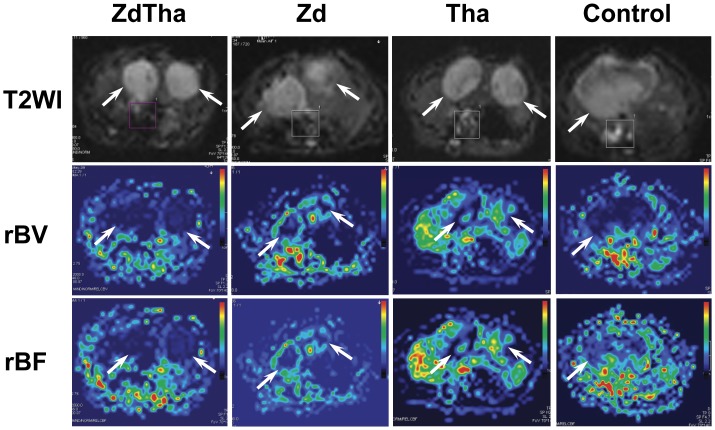
Figure 6. Representitive rBV and rBF maps at day 2 after treatment.
Top row: T2W images for anatomical visualization of tumors (arrow). Middle row: the same slice as shown at T2W images, rBV maps showed reduced level of rBV at various extents in tumors (arrow) from four groups. Bottom row: the same slice as shown above, rBF maps showed reduced level of rBF at various extents in tumors (arrow) from four groups.

