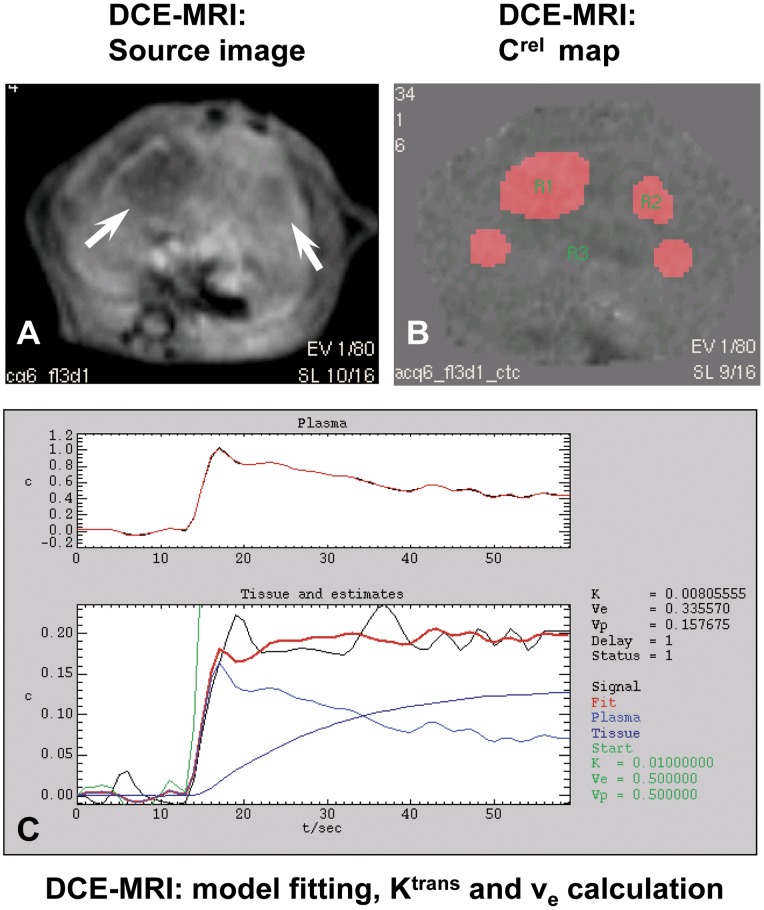
Figure 7. Representitive images illustrating the generation of Ktrans and ve from a case in the ZdTha group at day 2 after treatment. A:
a source image from DCE-MRI showed two tumors (arrow) with reduced perfusion. B: a relative contrast agent concentration (Crel) map derived from a serial of source images of DCE-MRI. Four regions of interest (ROIs) were contoured on the source images: the two tumors (R1 and R2), the normal liver (R3), and the abdominal aorta (R4, not shown). Then the four ROIs were transferred onto the Crel map. R4 was used to determine the arterial input function. C: The curves for the four ROIs were measured and fit with the Tofts and Kermode model to calculate the Ktrans and ve. The optimal overlap of the black line (signal) on the red line (fit) indicated the best fitting of tumor signal curve with the model curve.

