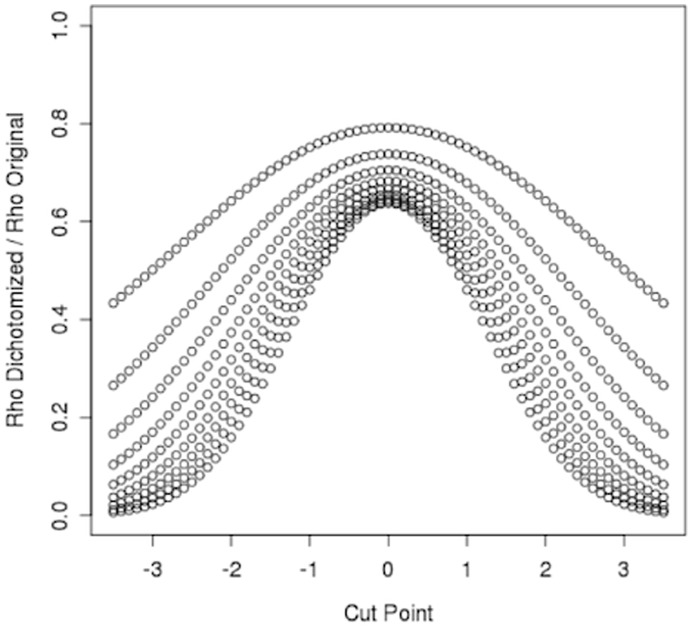
Figure 6. Affect of dichotomizing on the correlation between two normally distributed variables.
Correlation between dichotomized variables compared to the original correlation between two normally distributed variables. Each curve represents an original correlation value (ρ = 0.1 for the bottom curve to ρ = 0.9 for the top curve by 0.1). The same cut point was used for both variables.

