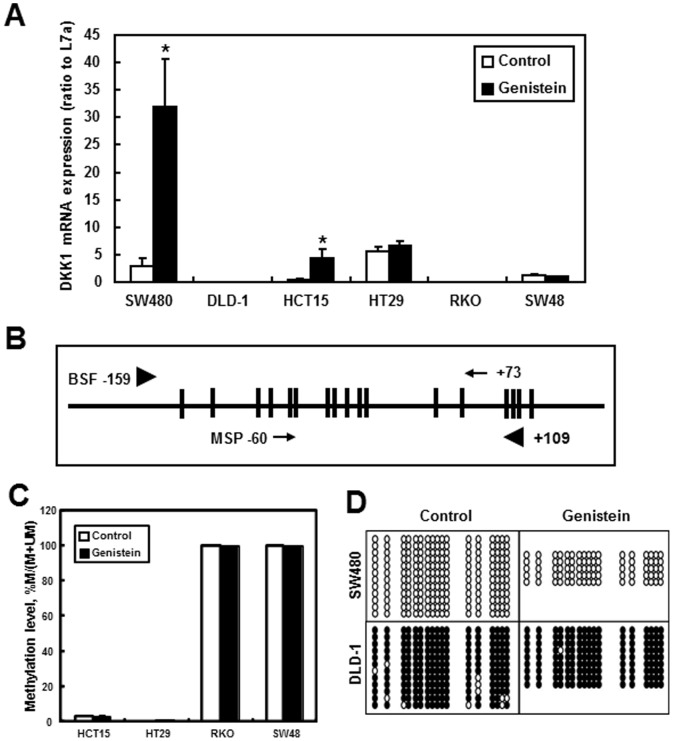
Figure 1. DNA methylation of Comparison of DKK1 expression promoter in colon cancer cell line SW480, DLD-1, HCT15, HT29, RKO and SW48.
SW480, DLD-1, HCT15, HT29, RKO and SW48 cells were treated with genistein for 2 d before sample collection for further analysis. A) Relative DKK1 mRNA expression. mRNA expression was analyzed using RT-PCR. Data were normalized to internal control L7a. Three independent cell samples were analyzed and presented as the mean ± SEM. Asterisks (*) indicate statistical significance compared to control within the same cell line (p<0.05). B) Schematic drawing of the DKK1 promoter region. Horizontal bar represents the CpG island within the promoter region. The vertical bars indicate individual CpG sites. Black arrowheads indicate the positions of the primers used for in PCR amplifications for Bisulfite Sequencing (−159 to +109). Arrows represent the positions of the primers used for PCR amplifications in MSP (−60∼+73). C) MSP of the DKK1 promoter region in HCT15, HT29, RKO and SW48. Y-axis represents the methylation level and the values are calculated as percentage of M/(M+UM). When not seen, error bars are within the columns. D) Bisulfite sequencing of the DKK1 promoter region in SW480 and DLD-1 cells. Each open circle represents an unmethylated C within a CpG while a filled circle represents a methylated C within a CpG. Each row of circles represents an individual clone used for sequencing.

