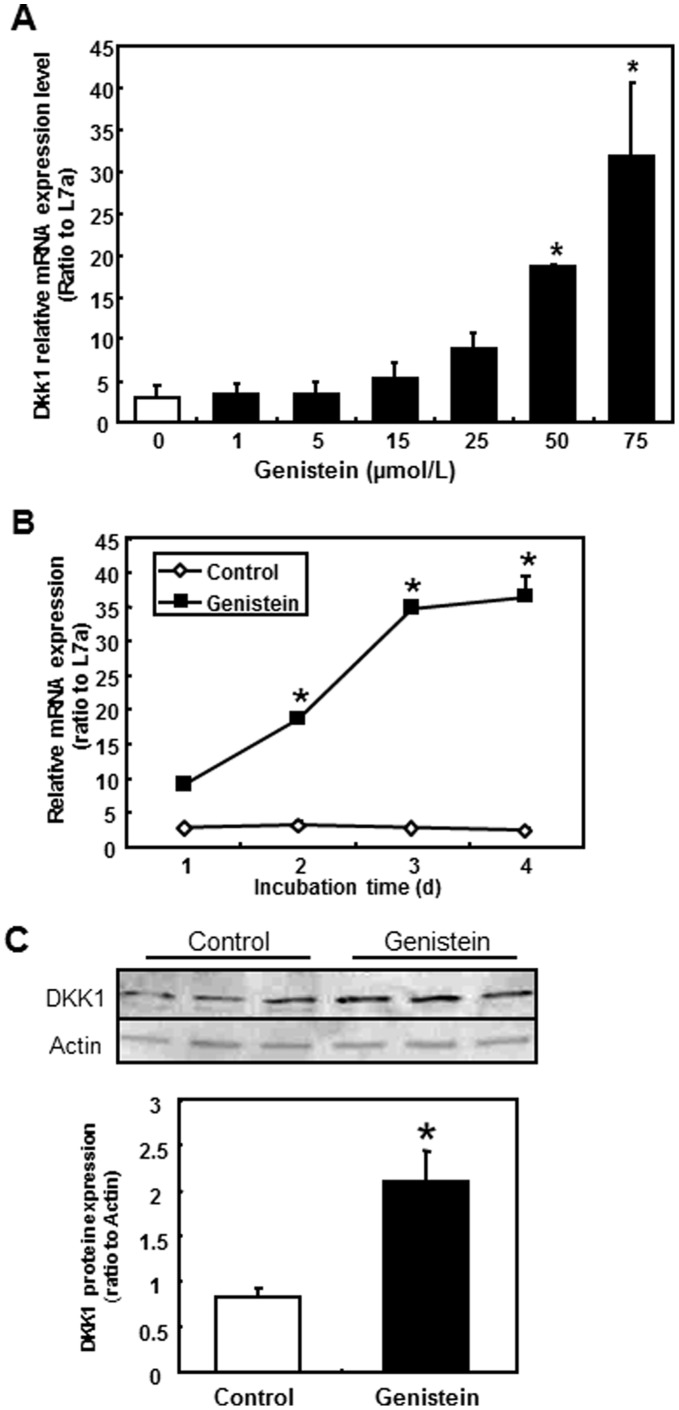
Figure 2. DKK1 expression in colon cancer cell line SW480 following genistein treatments.
A) SW480 cells were treated by various concentrations of genistein for 2 d. mRNA expression was analyzed by RT-PCR. X-axis indicates genistein concentrations and y-axis shows relative mRNA expression level. Data were normalized to internal control L7a. Asterisks (*) indicate statistical significance compared to 0 µmol/L genistein (p<0.05). B) Time course of DKK1 expression in SW480 following genistein treatment. SW480 cells were treated with 75 µmol/L of genistein and sampled at day 1, 2, 3 and 4 of the treatment. Data were normalized to internal control L7a. Three independent experiments were performed and presented as the mean±SEM. Where invisible, the error bars are contained within the bars. Asterisks (*) indicate statistical significance compared to d 1 of 75 µmol/L genistein (p<0.05). C) DKK1 protein expression. Whole cell protein extracts were collected from SW480 cells and western blot analysis of DKK1 was performed as described in materials and methods. A blot from western analysis is shown and the quantification represents the mean± SEM from 3 independent samples. Actin was used as the loading control. Asterisks (*) indicate statistical significance compared to control 0 µmol/L genistein (p<0.05).

