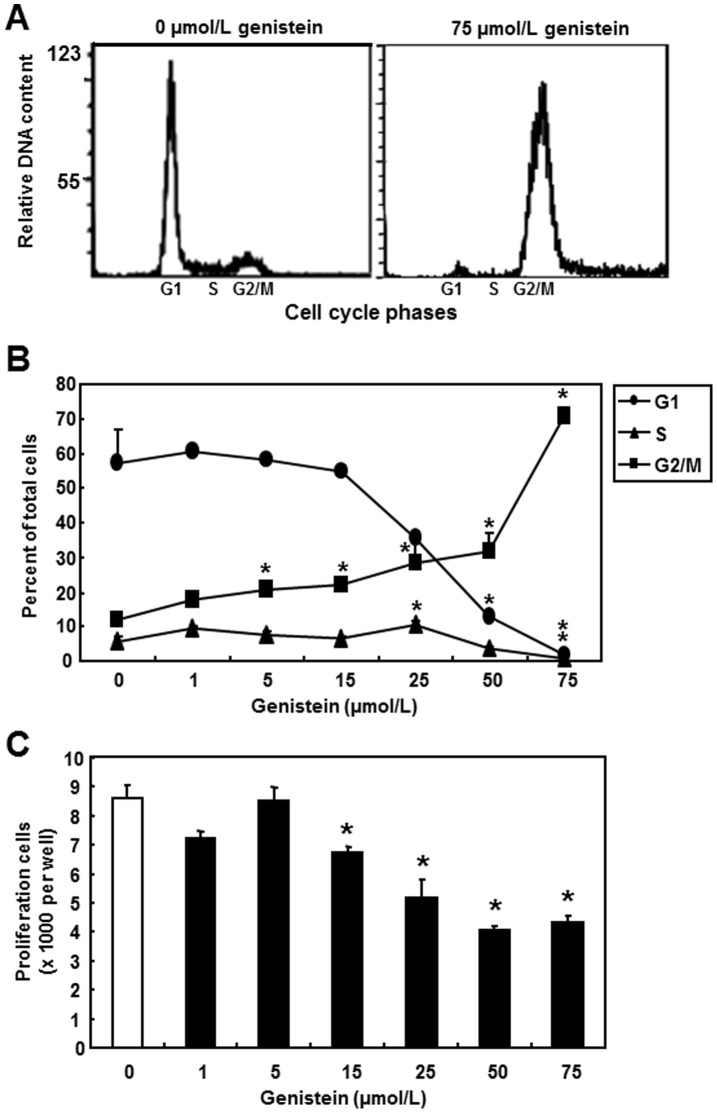
Figure 3. Effects of genistein treatment on cell physiology in SW480.
SW480 cells were treated with various concentrations of genistein for 2 d before sample collection. A) Representative DNA histograms of genistein treatment of 0 and 75 µmol/L by flow cytometry. Y-axis represents the relative DNA content and x-axis shows cell cycle stages. B) Cell cycle analysis of genistein treated cells. The percentage of cells in G1 (•), S (▴) or G2/M (▪) is shown. Data represent the means ± SEM of three independent experiments. C) WST-1 proliferation assay. WST-1 signals from each well were read at 450 nm for absorbance against a reference wavelength of 630 nm. Absorbance was converted to actual cell numbers using a standard generated by serial dilutions of a known number of cells. Three independent cell samples were analyzed and presented as the mean ± SEM. Asterisks (*) indicate statistical significance compared to 0 µmol/L of genistein (p<0.05).

