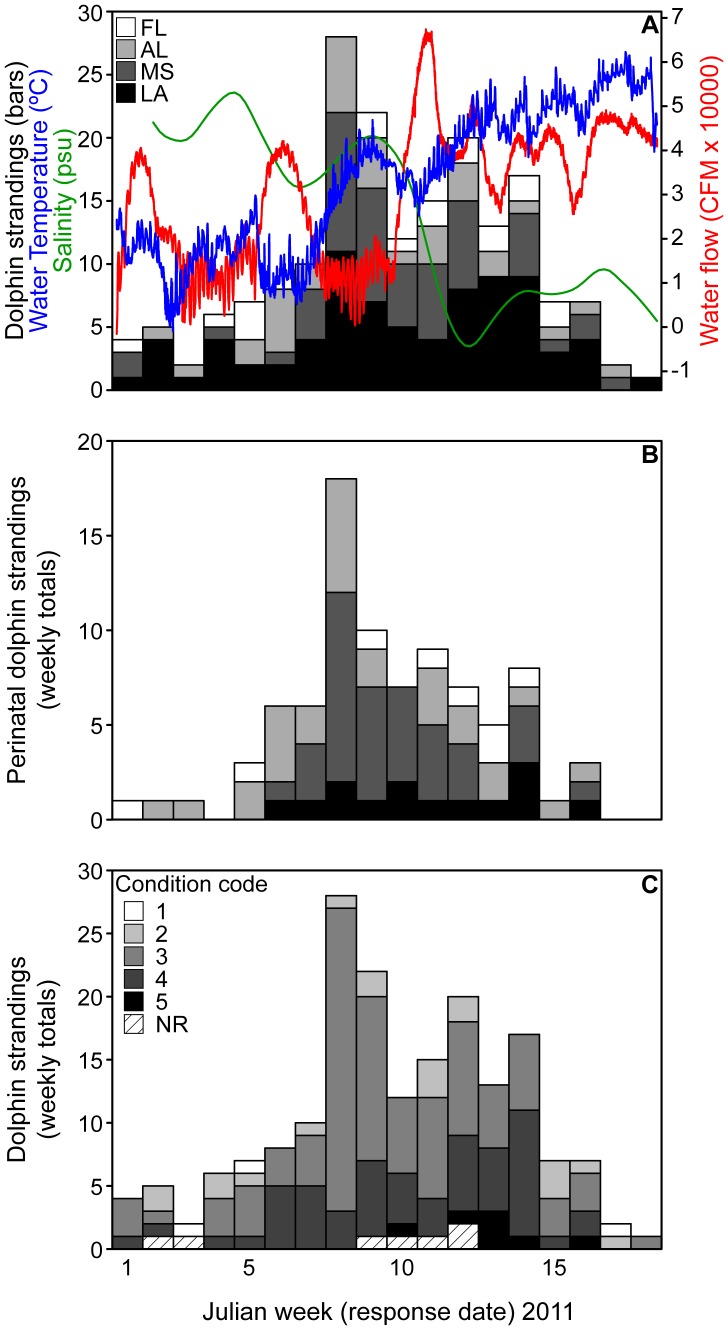
Figure 3. Dolphin strandings in 2011.
A) Total weekly bottlenose dolphin strandings for each state compared to surface water temperature (30 min intervals), flow (15 min intervals), and salinity (30 min intervals) measured at Mobile Bay, AL. B) Weekly perinatal dolphin strandings, separated by state (following the same legend as panel A). C) Total weekly bottlenose dolphin strandings, separated by carcass condition on the day of response in 2011. Carcass condition is reported using NMFS standard 5-point code in which 1 is live stranded, 2 is freshly dead, and 5 is most highly decomposed. NR = Not reported.

