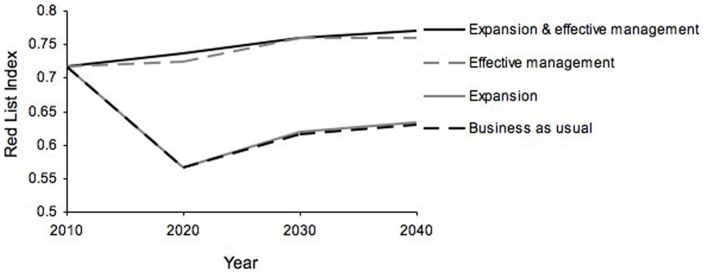
Figure 2. Changes over time in the Red List Index (RLI) under four policy scenarios for protected area management in Africa: 1) business-as-usual, 2) expansion of terrestrial PA network to 17% of each country, 3) improved management effectiveness of PAs, and 4) expansion to 17% with improved management effectiveness.
The RLI was calculated for 53 species of large mammals in sub-Saharan Africa; an increase in the RLI means a reduction in the average extinction risk of this set of species.

