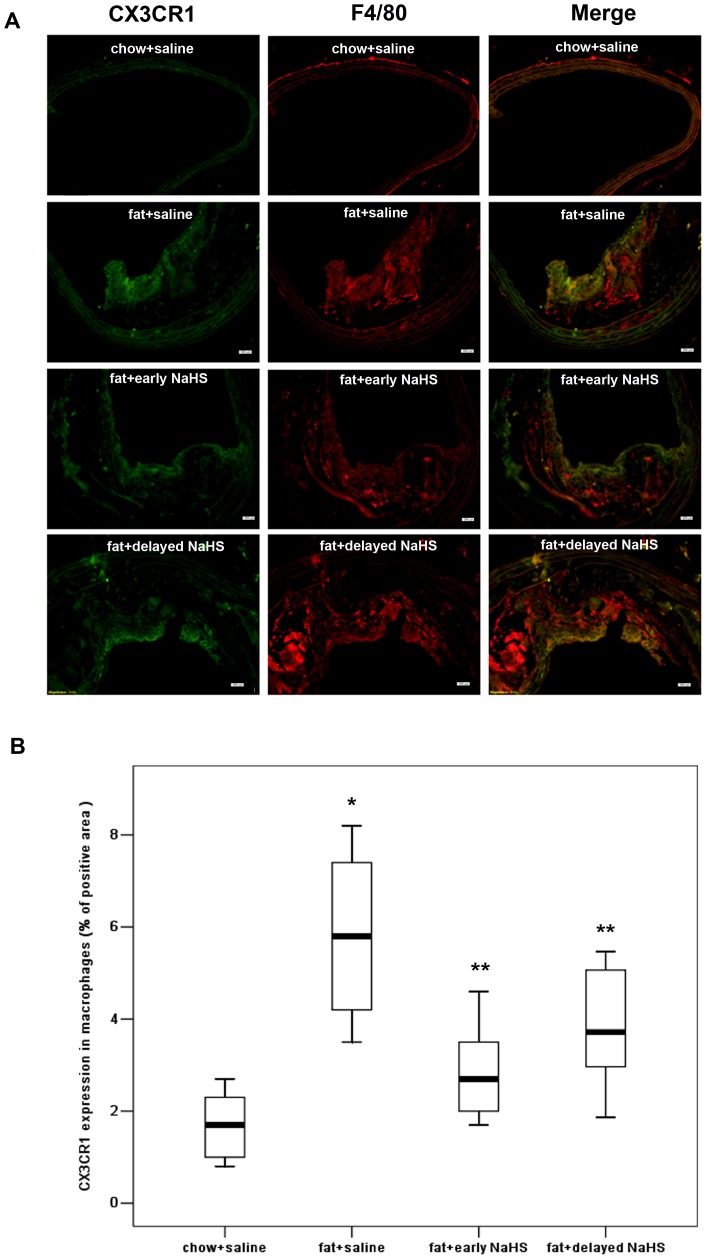
Figure 10. Effect of NaHS on the expression of CX3CR1 in macrophages in atherosclerotic plaques.
(A) Representative immunofluorescent stainging images for CX3CR1 and F4/80 colocalization were taken from BCA in mice with chow and saline, mice with fat feeding and saline, mice with fat feeding and early NaHS treatment or mice with fat feeding and delayed NaHS treatment. Scale bar for histological images = 20 µm. (B) BCA sections from mice with chow and saline, mice with fat feeding and saline, mice with fat feeding and early NaHS treatment or mice with fat feeding and delayed NaHS treatment, were quantified immunohistochemically for CX3CR1 positive staining. Results shown are the mean ± SEM (n = 6–8 animals in each group). *P<0.05, compared with mice with chow and saline; **P<0.05, compared with mice with fat feeding and saline.

