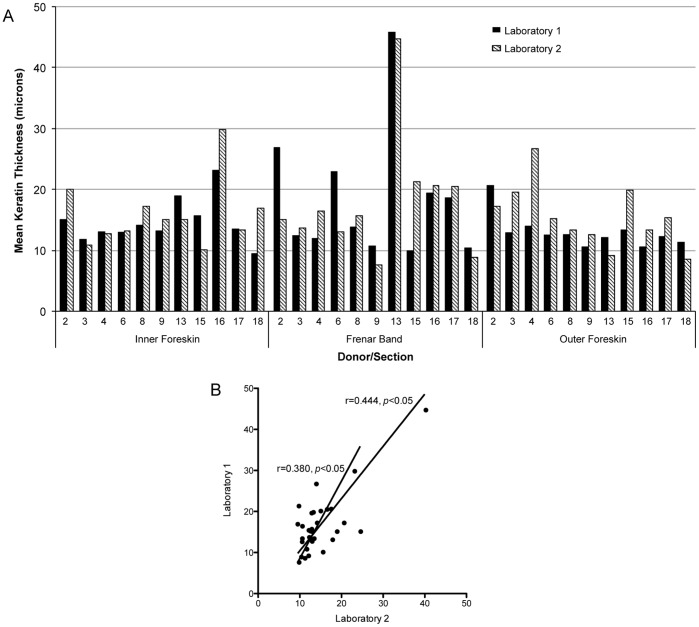
Figure 3. Data obtained from two independent laboratories.
(A) Mean thicknesses recorded by laboratory 1 (black bars) and laboratory 2 (hatched bars) for 11 donors. (B) Spearman rank correlation of two laboratory measurements. Shorter line = correlation coefficient calculated excluding donor sample #13.

