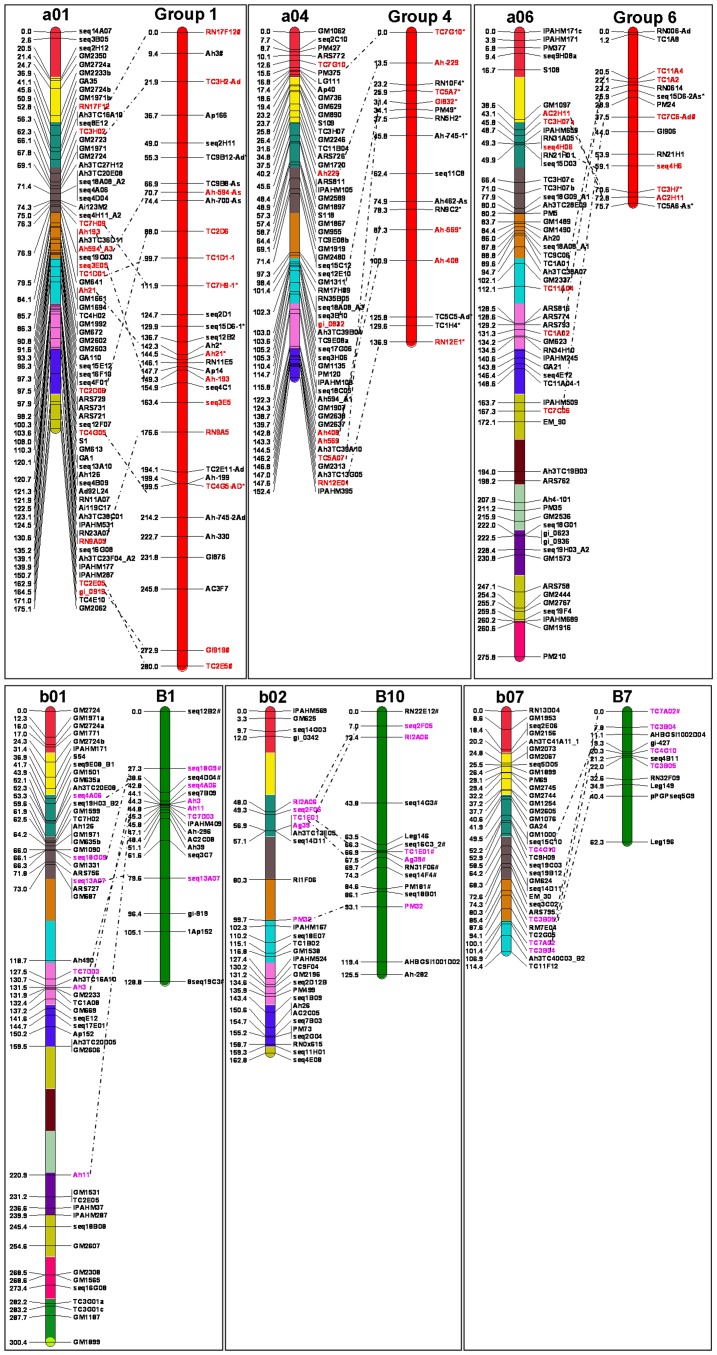
Figure 3. Comparison between the LGs of the reference consensus map and the diploid AA and BB maps.
The LGs of the reference consensus map are represented as a01 to a10 and b01 to b10. The LGs of AA map are named as Group 1 to Group 11 and for BB map as B1 to B10 respectively (published by Moretzsohn et al 2005, 2009). The AA map was represented by a red bar and the BB map with green colour. The common markers between corresponding LGs in the reference consensus map and AA map are indicated in red colour and pink colour with BB map.

