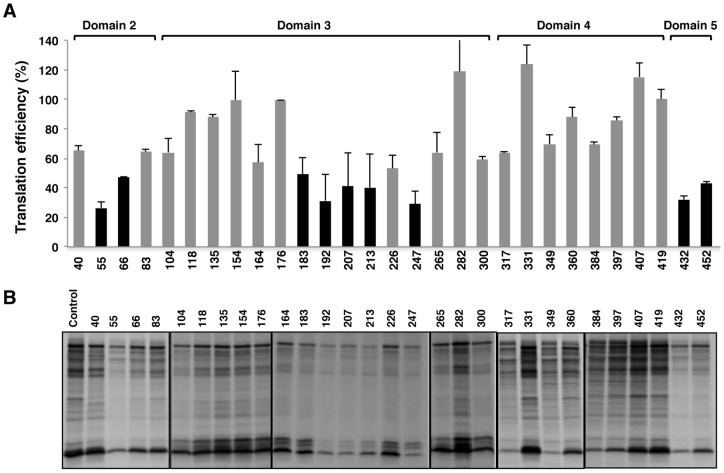
Figure 8. Changes in FMDV RNA translation efficiency in vitro induced by 2′OMe AONs.
(A). Autoradiograph of translation products obtained from FMDV RNA annealed, or not, with the indicated AONs in reticulocyte lysates. Translation assays were conducted as described in Material and Methods. (B). The intensity of each lane was determined by densitometry and made relative to the intensity of the lane without AON, which was set at 100%. Data correspond to the mean and standard deviation of the mean of three independent assays. A black bar denotes inhibitory capacity relative to control RNA.

