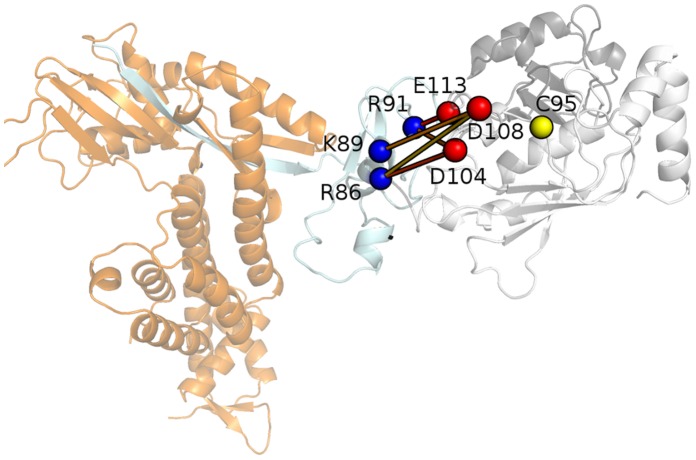
Figure 7. The Ub-Cdc34-E3 interface and the role of the acidic loop.
The salt bridge networks between Rbx1 arginine and lysine residues (blue spheres) and the acidic L7 residues (red spheres) of Cdc34 is shown as turned out from a macro-trajectory of two independent 40 ns MD simulations. The Ub, Cdc34 and the Rbx1 domain are shown in black, light grey and light cyan, respectively. The rest of the E3 enzyme is indicated in orange. The salt bridge networks are reported as sticks coloured from yellow (low persistence) to red (high persistence).

