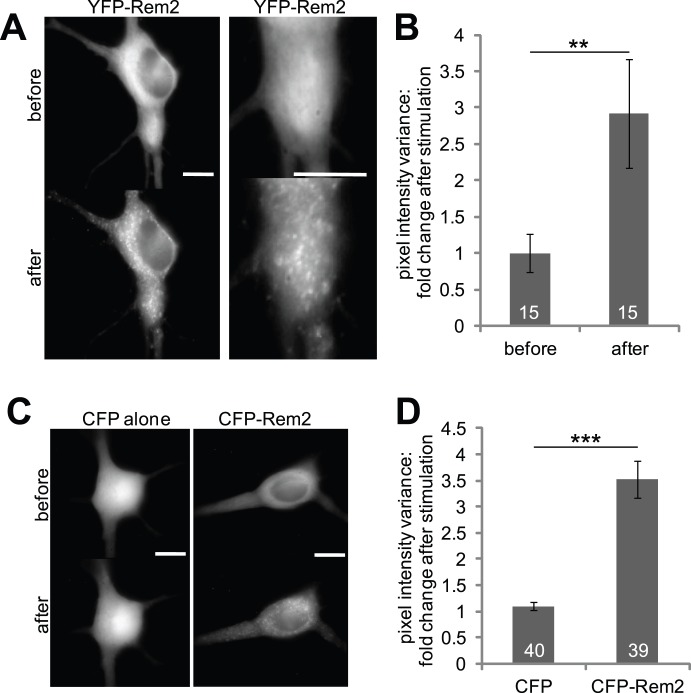
Figure 1. Rem2 overexpressed in neurons redistributes in response to neuronal stimulation.
(A) Images of neurons expressing either YFP or YFP-Rem2, before and after photoconductive stimulation, a non-invasive method of stimulating individual cells in a culture using light to target neurons grown on a silicon chip. To stimulate specific cells, we targeted the cell bodies of transfected neurons using a YFP filter, then stimulated the chip using 3–5 V of current for 2 msec duration at 20 Hz for 5 sec. Cells were imaged before and after stimulation to compare Rem2 distribution. Right panel is a magnification of the left panel to show details of Rem2 puncta. Scale bars represent 10 µm. (B) Normalized pixel value variance before stimulation, 1.0±0.26; after stimulation, 2.92±0.75, N = 15; paired t-test p = 0.006. Error bars represent SEM, and numbers within the bars indicate the number of cells averaged. (C) Images of neurons expressing either CFP or CFP-Rem2, before and after chemical stimulation. Individual cells in a culture of dissociated hippocampal neurons were imaged and their positions recorded, then the culture was stimulated with bath application of 25–100 µM glutamate/2.5–10 µM glycine. Follow-up images were taken of the recorded cells within 7 minutes of stimulation. Scale bars represent 10 µm. (D) Images such as in panel C were filtered and quantified by the variance in pixel values in each image. Variance was normalized to unstimulated cells. Ratio of CFP alone after/before stimulation, 1.10±0.07, N = 40; ratio of CFP-Rem2, 3.52±0.36, N = 39; t-test p<0.001. Numbers within the bars denote numbers of cells averaged for each bar. Error bars are SEM.

